Create Python Application for Sentiment Analysis
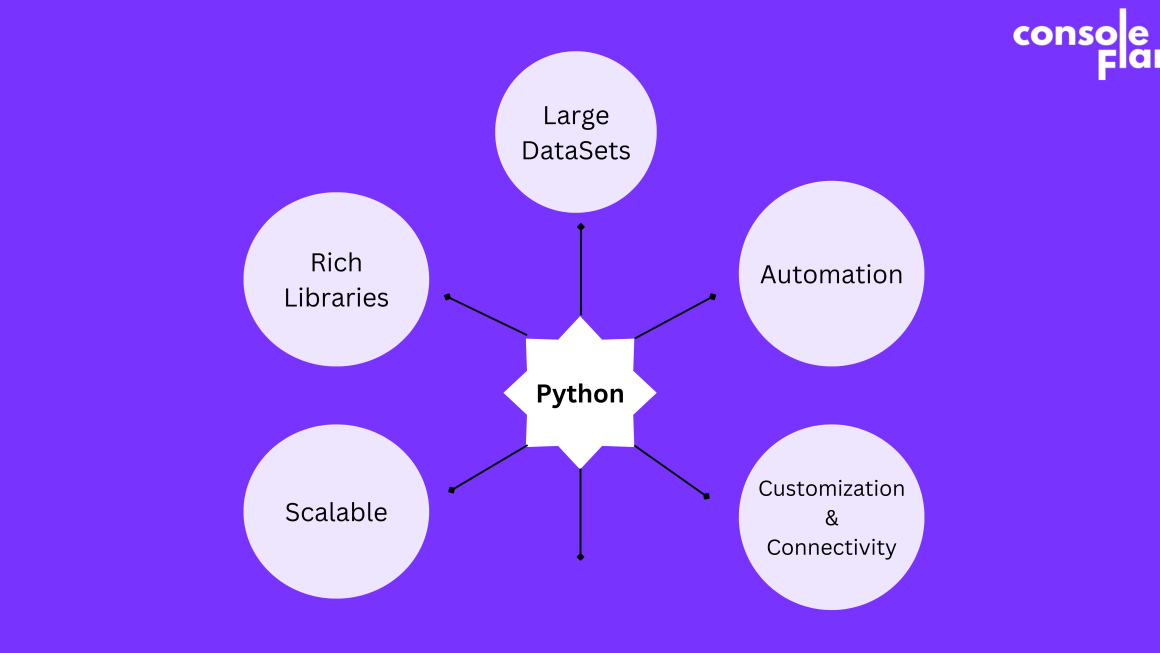
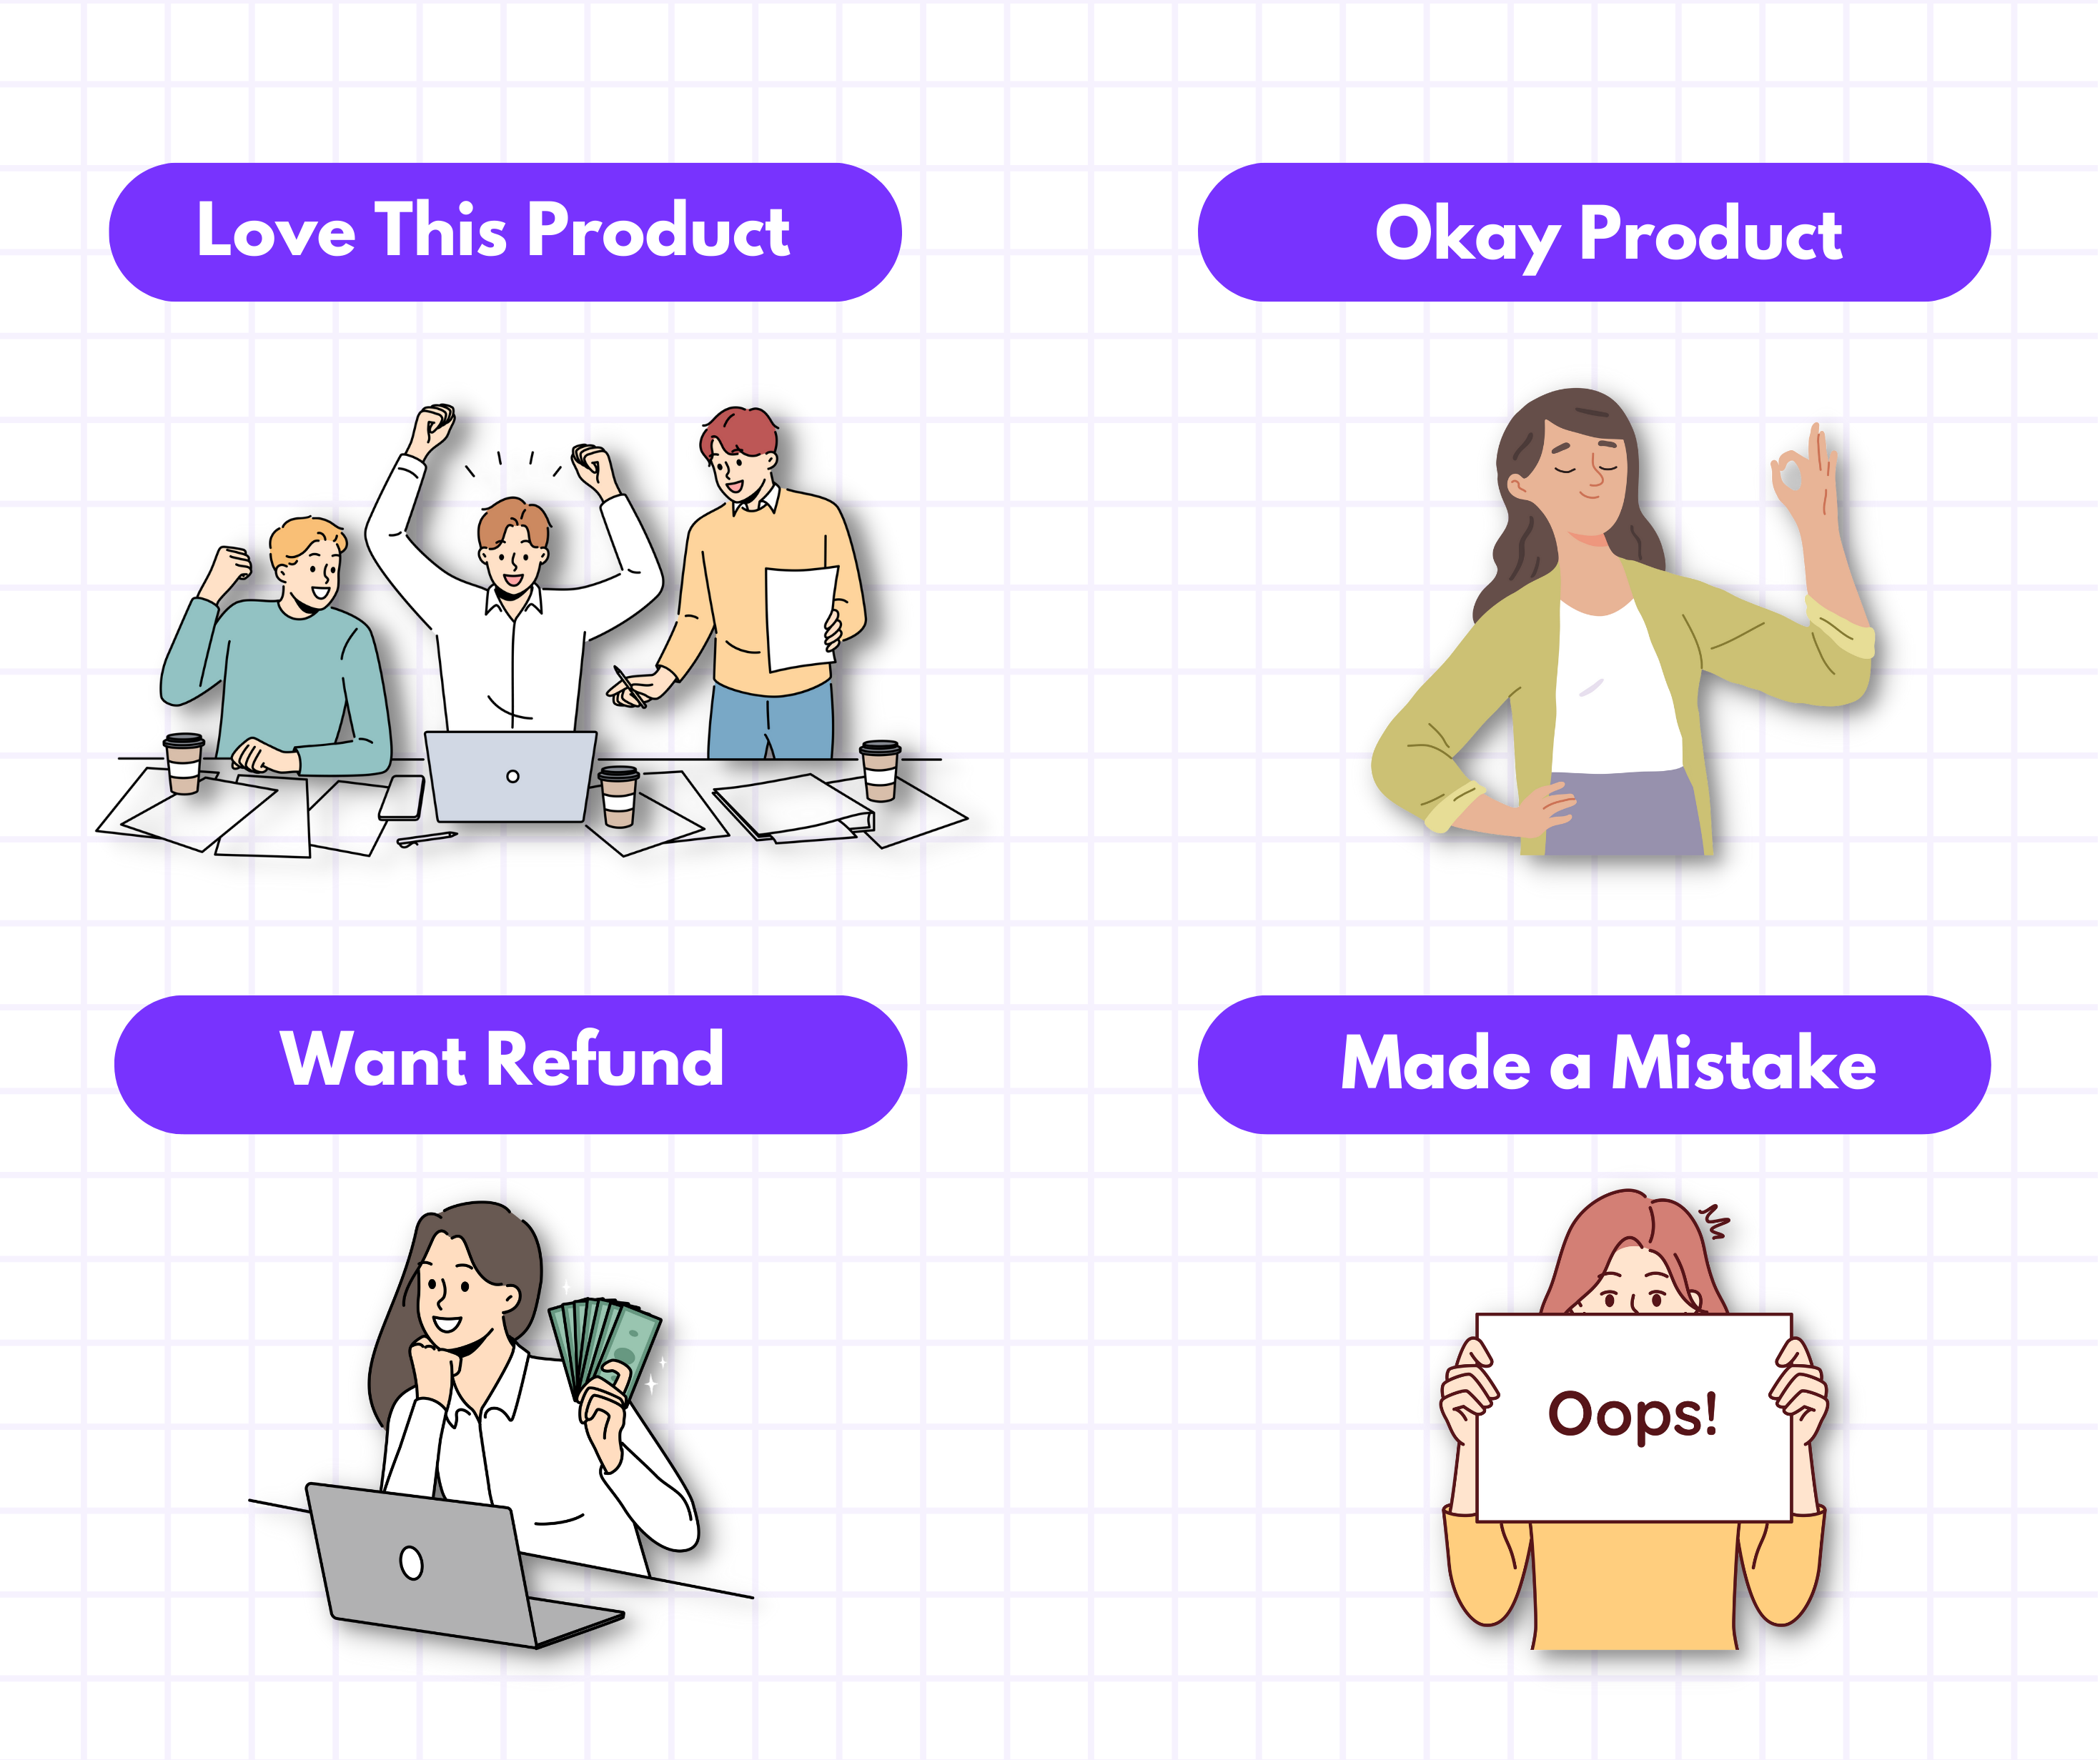
Sentiment analysis is to understand the feelings behind the text. We will create python application where you can upload any text file and it will return overall sentiment score and come up with the wordcloud.
Sentiment analysis is a technique to understand emotions in text.
It will give your client a detailed analysis how their product is perceived.

Step 1: Setting up the Environment
Before diving into the code, ensure you have Python installed on your system. We’ll be using several libraries, so let’s install them using pip:pip install streamlit wordcloud textblob matplotlib nltk.
Sentiment analysis interprets emotions conveyed in written text.
Step 2: Importing Necessary Libraries
Let’s start by importing the libraries we’ll be using in our application.
Streamlit will be our web application framework, WordCloud for visualizing word clouds, TextBlob for sentiment analysis, NLTK for natural language processing tasks, and matplotlib for plotting charts.
Streamlit is an open-source Python library that makes it easy to create and share beautiful, custom web apps for machine learning and data science. In just a few minutes you can build and deploy powerful data apps. So let’s get started!
import streamlit as st
from wordcloud import WordCloud
from textblob import TextBlob
import nltk
from nltk.corpus import stopwords
import re
import matplotlib.pyplot as plt
from collections import Counter
Step 3: Preprocessing Functions
We’ll define some helper functions to preprocess the text data before performing sentiment analysis. These functions will remove stopwords, custom words, numbers, and symbols from the text.
# Function to remove stopwords
def remove_stopwords(text):
stop_words = set(stopwords.words("english"))
return ' '.join([word for word in text.split() if word.lower() not in stop_words])
# Function to remove custom words from text
def remove_custom_words(text, custom_words):
for word in custom_words:
text = text.replace(word, '')
return text# Function to remove numbers and symbols from text
def remove_numbers_and_symbols(text):
text = re.sub(r'[^a-zA-Z\s]', '', text)
return textStep 4: Sentiment Analysis and Visualization
Now, let’s define functions to perform sentiment analysis and visualize the results. We’ll extract adjectives, analyze word frequency, sentiment scores, and named entities from the text data.# Function to generate word cloud from adjectives
def generate_adjective_wordcloud(text):
blob = TextBlob(text)
adjectives = [word.lower() for (word, pos) in blob.tags if pos.startswith('JJ')]

if adjectives:
adjective_text = ' '.join(adjectives)
wordcloud = WordCloud(width=800, height=400, background_color="white").generate(adjective_text)
fig, ax = plt.subplots(figsize=(10, 5))
plt.imshow(wordcloud, interpolation="bilinear")
ax.axis("off")
st.pyplot(fig)
else:
st.warning("No adjectives found.")
# Function to analyze word frequency
def analyze_word_frequency(text, top_n=10):
adjectives = [word.lower() for (word, pos) in TextBlob(text).tags if pos.startswith('JJ')]
word_freq = Counter(adjectives)
return dict(word_freq.most_common(top_n))# Function to perform sentiment analysis
def analyze_sentiment(text):
blob = TextBlob(text)
sentiment_score = blob.sentiment.polarity
return sentiment_score# Function to analyze named entity frequency
def analyze_named_entity_frequency(text, top_n=10):
entities = [ent for ent in TextBlob(text).noun_phrases]
entity_freq = Counter(entities)
return dict(entity_freq.most_common(top_n))Step 5: Building the Streamlit App
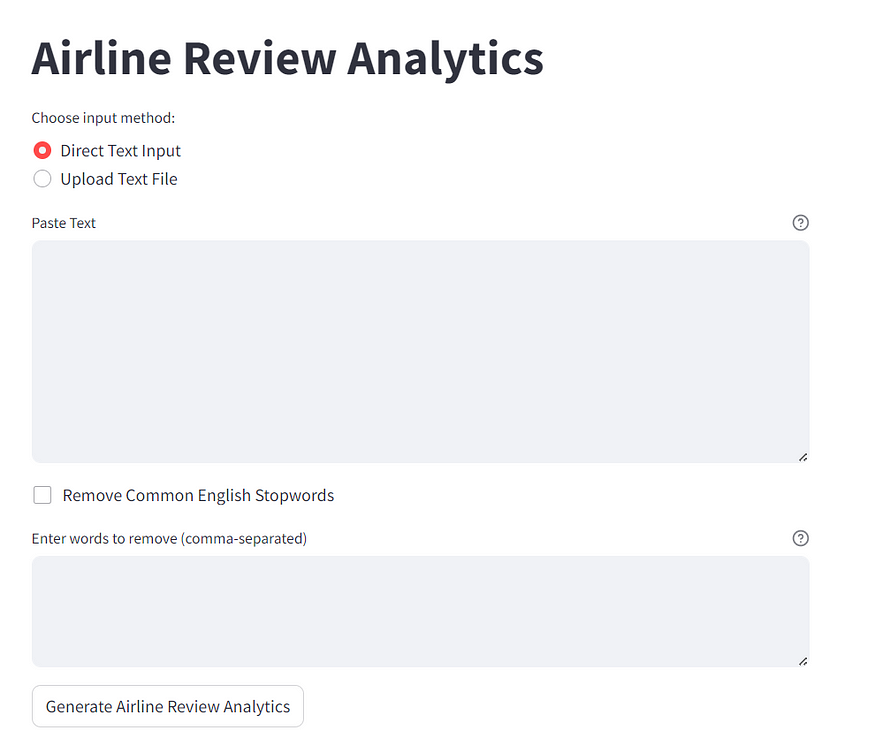
Now, let’s create our Streamlit application. We’ll provide options for users to input text directly or upload a text file. Users can choose to remove stopwords and specify custom words to remove.# Streamlit app
st.title(“Sentiment Analysis App”)
# Text input area or file upload
text_input_method = st.radio("Choose input method:", ("Direct Text Input", "Upload Text File"))
if text_input_method == "Direct Text Input":
user_input = st.text_area("Paste Text", value="", height=200, help="Enter your text here.")
else:
uploaded_file = st.file_uploader("Upload a Text File (.txt)", type=["txt"])
if uploaded_file is not None:
user_input = uploaded_file.read().decode("utf-8")
else:
user_input = ""Step 6: Analyzing Text and Generating Insights
Finally, we’ll analyze the user input text and generate various visualizations such as word clouds, word frequency charts, sentiment analysis plots, and named entity frequency charts.# Extract adjectives and generate analytics when the user clicks the button
if st.button("Generate Analytics", help="Click to extract adjectives and generate analytics."):
with st.spinner("Generating..."):
if user_input:
# Remove stopwords and custom words
if remove_stopwords:
user_input = remove_stopwords(user_input)
if custom_words:
user_input = remove_custom_words(user_input, custom_words)# Remove numbers and symbols
user_input = remove_numbers_and_symbols(user_input)# Generate word cloud
generate_adjective_wordcloud(user_input)# Display bar chart for word frequency
st.subheader("Adjective Frequency Analysis")
adjective_freq = analyze_word_frequency(user_input, top_n=10)
fig, ax = plt.subplots(figsize=(10, 5))
ax.bar(adjective_freq.keys(), adjective_freq.values())
plt.xticks(rotation=45, ha="right")
st.pyplot(fig)# Visualize sentiment scores
st.subheader("Sentiment Analysis Visualization")
sentiment_scores = analyze_sentiment(user_input)
st.write("Sentiment Score:", sentiment_scores)# Named Entity Recognition (NER) and display the entities
st.subheader("Named Entities Analysis")
entity_freq = analyze_named_entity_frequency(user_input)
if entity_freq:
fig, ax = plt.subplots(figsize=(10, 5))
ax.barh(list(entity_freq.keys()), list(entity_freq.values()))
ax.set_xlabel('Frequency')
ax.set_ylabel('Named Entities')
st.pyplot(fig)
else:
st.warning("No named entities found.")else:
st.warning("Please enter some text or upload a text file.")Step 7: Check
To check the Streamlit app, simply save the code in a Python file (e.g., sentiment_analysis_app.py) and run the following command in your terminal:
streamlit run sentiment_analysis_app.pyDeployment
Step 1: Sign up for Streamlit Sharing
Visit the Streamlit Sharing website (https://share.streamlit.io) and sign up for an account if you haven’t already. You’ll need a Streamlit Sharing account to deploy and host your app.
Step 2: Organize Your Project
Make sure your sentiment analysis app code is organized in a single Python script (e.g., sentiment_analysis_app.py) and that all necessary dependencies are listed in the requirements.txt file.
Step 3: Create a GitHub Repository
If your code isn’t already on GitHub, create a new repository to host your Streamlit app. Push your code (Python script and requirements.txt) to this repository.
Step 4: Connect GitHub Repository to Streamlit Sharing
Log in to your Streamlit Sharing account and navigate to the dashboard. Click on the “New app” button, then select “GitHub” as the deployment method. Connect your GitHub repository by searching for it and selecting it.
Step 5: Configure Deployment Settings
Once your GitHub repository is connected, Streamlit Sharing will automatically detect the main Python script (sentiment_analysis_app.py). If not, specify the path to your main script. You can also specify any additional setup commands or configuration settings required for your app.
Step 6: Deploy Your App
After configuring the deployment settings, simply click on the “Deploy” button. Streamlit Sharing will start building and deploying your app. This process may take a few minutes, depending on the size of your app and the current load on the servers.
Step 7: Access Your Deployed App
Once deployment is complete, Streamlit Sharing will provide you with a URL to access your deployed app. You can share this URL with others to allow them to interact with your sentiment analysis app in a web browser.
Step 8: Monitor and Manage Your App
You can monitor the status of your deployed app from the Streamlit Sharing dashboard. If you need to make changes or updates to your app, simply push the updated code to your GitHub repository, and Streamlit Sharing will automatically redeploy the app with the latest changes.
Final Product:
Conclusion
Deploying a Streamlit app on Streamlit Sharing is a straightforward process that allows you to quickly share your data science projects and web applications with others. By following these steps, you can deploy your sentiment analysis app and make it accessible to a wider audience for gathering insights from textual data.
This Python Project used Streamlit , nltk and stopwords to build a sentiment analysis. Such is the power of streamlit. Try to explore Streamlit and build your own projects. Do tell in comments how helpful this blog was. To learn Python and Data analysis, You can reach us at ConsoleFlare.
If you wish to learn more about data science or want to curve your career in the data science field feel free to join our free workshop on Masters in Data Science with PowerBI, where you will get to know how exactly the data science field works and why companies are ready to pay handsome salaries in this field.
In this workshop, you will get to know each tool and technology from scratch that will make you skillfully eligible for any data science profile.
To join this workshop, register yourself on consoleflare and we will call you back.
Thinking, Why Console Flare?
- Recently, ConsoleFlare has been recognized as one of the Top 10 Most Promising Data Science Training Institutes of 2023.
- Console Flare offers the opportunity to learn Data Science in Hindi, just like how you speak daily.
- Console Flare believes in the idea of “What to learn and what not to learn” and this can be seen in their curriculum structure. They have designed their program based on what you need to learn for data science and nothing else.