Matplotlib vs Seaborn
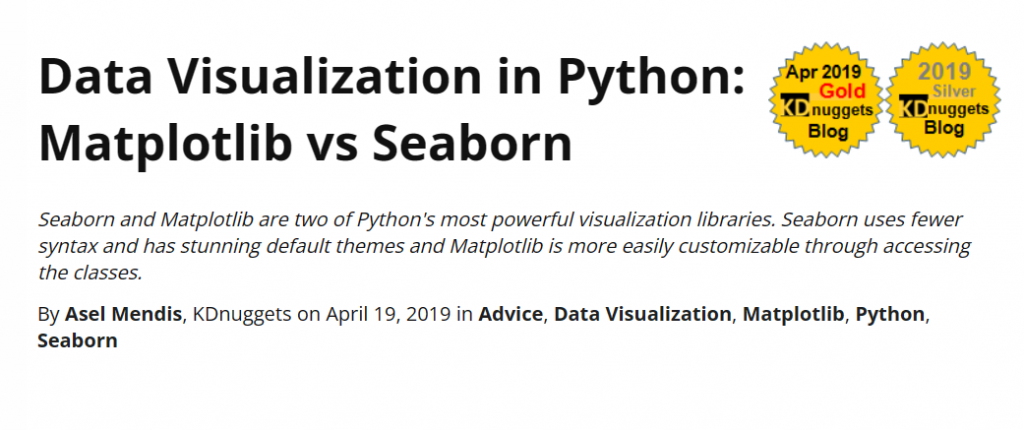
Data visualization is a crucial aspect of data analysis and interpretation. Python, being a popular programming language for data analysis, provides several libraries for creating visually appealing and informative plots. Among these, Matplotlib and Seaborn stand out as powerful tools for data visualization. In this article, we will explore the differences between Matplotlib and Seaborn, highlighting their features, use cases, and advantages.
What is Matplotlib?
Matplotlib is a widely used Python library for creating static, animated, and interactive visualizations. It provides a flexible and comprehensive set of plotting capabilities, allowing users to create a wide range of charts, graphs, and plots. With Matplotlib, you have fine-grained control over every aspect of your visualization, from the axes to the color schemes.
What is Seaborn?
Seaborn is a Python data visualization library built on top of Matplotlib. It offers a higher-level interface and enhances Matplotlib’s capabilities by providing additional statistical visualizations, improved aesthetics, and simplified syntax. Seaborn is particularly useful for creating informative statistical plots and exploring relationships between variables in your data.
You’re reading the article, Key Differences – Matplotlib VS Seaborn.
Matplotlib vs Seaborn – Key Differences
Syntax and Ease of Use
Matplotlib: Matplotlib follows a more low-level approach, requiring users to write more code to create visualizations. While this provides flexibility, it can also make the process more complex, especially for beginners.
Seaborn: Seaborn, on the other hand, focuses on simplicity and ease of use. It provides a higher-level interface that simplifies the process of creating appealing plots, making it more beginner-friendly.
Default Aesthetics
Matplotlib: By default, Matplotlib’s plots have a utilitarian look with basic color schemes. While customization options are available, creating visually appealing plots often requires additional effort and tweaking.
Seaborn: Seaborn emphasizes aesthetics and provides pleasant default styles and color palettes. This makes it easier to create visually appealing plots right out of the box, requiring less manual customization.
You’re reading the article, Key Differences – Matplotlib VS Seaborn.
Statistical Visualizations
Matplotlib: Matplotlib offers a broad range of plot types and customization options but has limited built-in statistical plotting functions. You can manually compute statistics and overlay them on Matplotlib plots if needed.
Seaborn: Seaborn specializes in statistical visualizations and offers a wide array of built-in statistical plotting functions. It simplifies the creation of statistical plots, such as distribution plots, regression plots, and categorical plots, by automating the computation of summary statistics.
Integration with Pandas
Matplotlib: Matplotlib seamlessly integrates with Pandas, a popular data manipulation library in Python. It allows you to create plots directly from Pandas DataFrames and Series, simplifying the visualization process when working with tabular data.
Seaborn: Seaborn also integrates well with Pandas, enabling you to create plots directly from Pandas data structures. Additionally, Seaborn provides specialized functions that take advantage of Pandas’ capabilities for grouped and categorical data visualization.
You’re reading the article, Key Differences – Matplotlib VS Seaborn.
Customization
Matplotlib: Matplotlib offers extensive customization options, allowing you to have full control over the appearance of your plots. You can customize every element, including axes, titles, legends, and tick labels, to suit your specific requirements.
Seaborn: Seaborn simplifies customization by providing high-level functions with sensible defaults. While it offers customization options, they are generally more limited compared to Matplotlib. However, Seaborn’s default styles are often sufficient for many visualizations.
You’re reading the article, Key Differences – Matplotlib VS Seaborn.
Conclusion
Both Matplotlib and Seaborn are valuable tools for data visualization in Python, each with its own strengths. If you’re willing to pursue your career as a data analyst and want to learn Python libraries like Numpy, Pandas, Matplotlib, and Seaborn, explore these affordable industry-led certification programs by ConsoleFlare.
2. Masters in Data Science With Power BI
Hope you liked reading the article, Key Differences – Matplotlib VS Seaborn. Please share your thoughts in the comments section below.


