
Data Science Project For Resume
If you are applying for Data Science Job roles, you must have known the importance of data science projects by now.
It is really important to have great projects in your bag. But Most resumes are filled with projects that do not cover anything important and you can differentiate them just by looking at them.
The project we will cover today is not one of them. We will continue the series of projects in data science.
So let’s open Visual Studio Code or Jupyter Notebook and deep dive into today’s Project. Let’s add this Data Science Project.
- Demonstrates Skills: A data science project showcases your technical skills, problem-solving abilities, and proficiency with relevant tools and technologies. It provides concrete evidence of your capabilities to potential employers.
- Hands-On Experience: Employers value practical experience. A data science project allows you to apply theoretical knowledge to real-world problems, demonstrating your ability to work with data and derive meaningful insights.
- Differentiation: In a competitive job market, having a unique and impactful project can set you apart from other candidates. It gives you an opportunity to showcase your creativity, initiative, and innovation.
- Depth of Understanding: Working on a project requires a deeper understanding of data science concepts and methodologies. It shows that you have gone beyond theoretical learning and have practical experience in applying those concepts.
- Problem-Solving Skills: Data science projects often involve addressing complex problems, which can demonstrate your analytical and problem-solving skills. Employers are interested in candidates who can effectively solve real-world challenges.
- Communication Skills: Presenting your project on your resume or during interviews allows you to communicate your findings, methodologies, and the impact of your work effectively. This demonstrates your ability to convey technical information to non-technical stakeholders.
- Relevance to Job Role: Tailoring your project to align with the job role or industry you’re targeting can demonstrate your understanding of the specific requirements and challenges in that domain.
- Continuous Learning: Undertaking a data science project shows that you are proactive about learning and developing your skills outside of formal education or employment. It highlights your commitment to continuous improvement and staying updated with industry trends.
- Portfolio Building: Over time, as you complete multiple projects, you can build a portfolio showcasing a diverse range of skills, experiences, and accomplishments, further enhancing your credibility and marketability.
Data Science Project Objective:
Name Of the Project: Crime Data Analysis
Dataset: Crime data 2020 to present (Source : Data.Gov)
Objective: In this Data Science Project we will analyze the patterns of crime incidents in the dataset to identify high-crime areas, peak times of criminal activity, and potential correlations between specific crime types, victim demographics, and incident locations. Additionally, explore the effectiveness of law enforcement responses by examining the distribution of investigation statuses and arrests in relation to reported crimes.
Dataset Information:
- DR_NO: A unique identifier for each reported crime incident.
- Date Rptd: The date the crime was reported.
- DATE OCC: The date when the crime occurred.
- TIME OCC: The time when the crime occurred.
- AREA NAME: The name of the police reporting area where the crime occurred (e.g., Wilshire, Central, Southwest, Van Nuys, Hollywood, Southeast).
- Crm Cd: The crime code associated with the incident.
- Crm Cd Desc: A description of the crime based on its code.
- Vict Age: The age of the victim.
- Vict Sex: The gender of the victim (M for Male, F for Female).
- Vict Descent: The descent or ethnicity of the victim.
- Premis Cd: The premise code associated with the incident.
- Premis Desc: A description of the premises where the crime occurred.
- Weapon Used Cd: Code indicating whether a weapon was used.
- Weapon Desc: Description of the weapon used (if applicable).
- Status: The current status of the investigation or case.
- Status Desc: Description of the status (e.g., Adult Arrest, Invest Cont for Investigation Continued).
- LOCATION: The general location where the incident occurred.
- Cross Street: The nearest cross street to the location of the incident.
- LAT: Latitude coordinates of the incident location.
- LON: Longitude coordinates of the incident location.
Remove all the other Columns in your dataset as we do not need it.
Data Science Project:
Import Necessary Libraries and load the dataset:
For this data science project, we will use these libraries.
import pandas as pd
import matplotlib.pyplot as plt
import numpy as np
import seaborn as sns

df = pd.read_csv('Crime_Data_from_2020_to_Present.csv')
df
Output:

There are total 883987 rows and 20 columns in this dataset. It’s a data science project with huge data.
Find Missing Values
df.isnull().sum()Output:
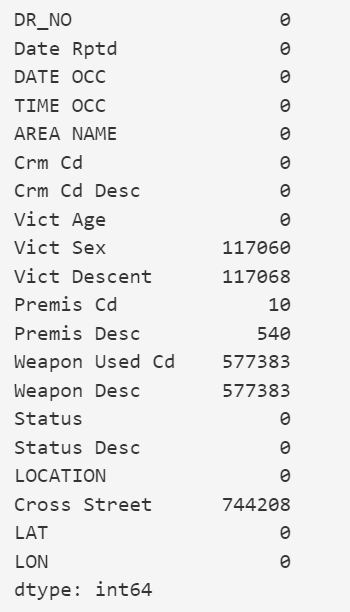
Here as you can see, That there are missing values in Victim age and its gender and weapon , Well we cannot do anything about it , so just leave it. If it will be a problem for us , we will deal with it later.
Now Let’s Start Analyzing:
Spatial Analysis:
- Which areas have the highest and lowest crime rates?
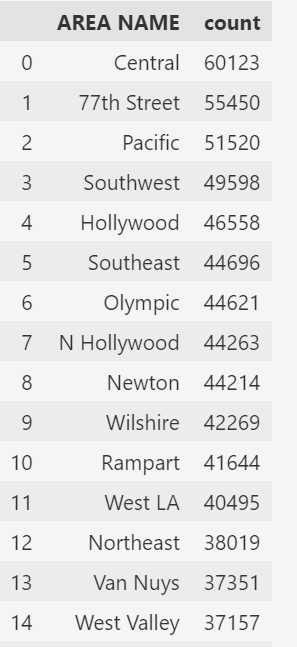
To find which Area has the highest and lowest crime rate, we can come up with a Bar chart showing the Number of Crimes in a particular Area. So we can use value_counts for this step to count a number of cases.
ndf = df['AREA NAME'].value_counts().reset_index()
Output:
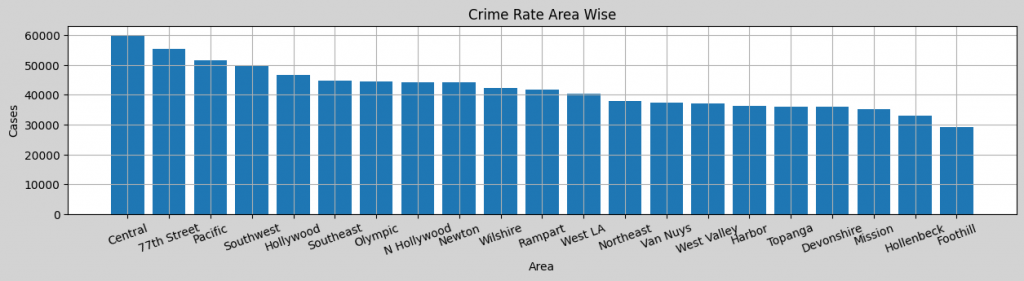
Now we need to convert this into a bar chart that we can do simply using matplotlib.
plt.figure(figsize=(15,3),facecolor='lightgray')  #to set size and color
plt.bar(ndf['AREA NAME'],ndf['count'])  # to create bar plot
plt.title('Crime Rate Area Wise')  # title of plot
plt.xlabel('Area')  # name of x
plt.xticks(rotation=20)  # rotate x value by 20 degrees
plt.ylabel('Cases') # name of y
plt.grid()
plt.show()
Output:
2. Are there specific locations (streets, neighborhoods) with a consistently high number of incidents?
ndf = df['LOCATION'].value_counts().reset_index().head(10)
plt.figure(figsize=(15,3),facecolor='lightgray')  # to set size and color of the graph
plt.bar(ndf['LOCATION'],ndf['count'])
plt.title('Crime Rate Area Wise')
plt.xlabel('LOCATION')
plt.xticks(rotation=45)
plt.ylabel('Cases')
plt.grid()
plt.show()
Output :

Temporal Analysis
- What are the temporal trends in crime over the time period covered by the dataset?
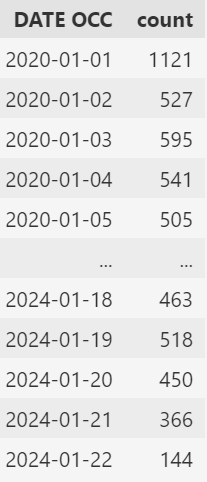
df['DATE OCC'] = pd.to_datetime(df['DATE OCC'])
df['Date Rptd'] = pd.to_datetime(df['Date Rptd'])
ndf = df['DATE OCC'].value_counts().reset_index()
ndf = ndf.sort_values(by='DATE OCC')
Output:
Now, we show this over line chart.
plt.figure(figsize=(10,5))
plt.plot(ndf['DATE OCC'],ndf['count'])
plt.title('Temporal Trend Yearly')
plt.xlabel('Date')
plt.ylabel('Frequency')
plt.grid()
plt.show()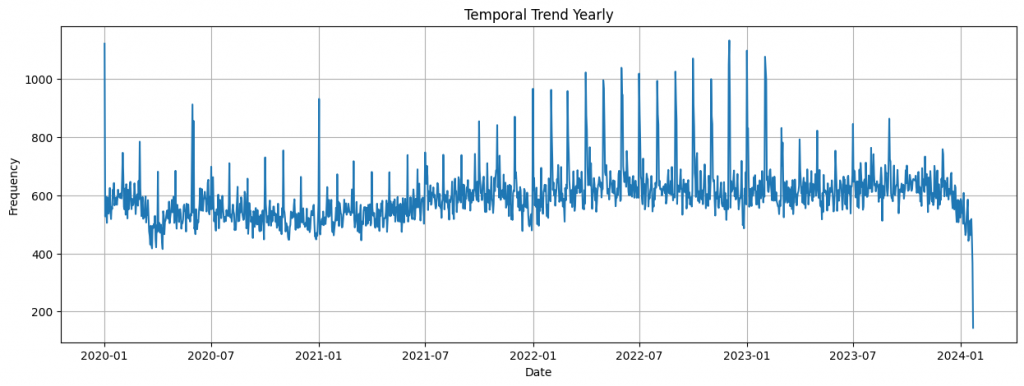
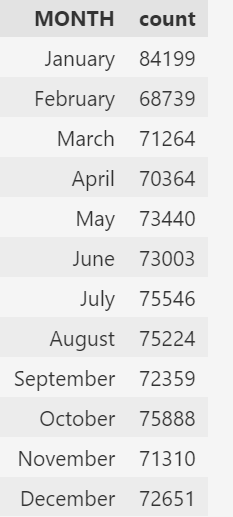
2. Are there specific months,when certain crimes are more prevalent?
df['MONTH'] = df['DATE OCC'].dt.month_name()
ndf = df['MONTH'].value_counts().reindex(['January','February',
'March','April','May','June','July','August','September','October','November','December'])
ndf
Output
plt.figure(figsize=(15,5))
plt.bar(ndf['MONTH'],ndf['count'],alpha=0.4)
plt.title('Month Trend')
plt.xlabel('Date')
plt.ylabel('Frequency')
plt.grid()
plt.show()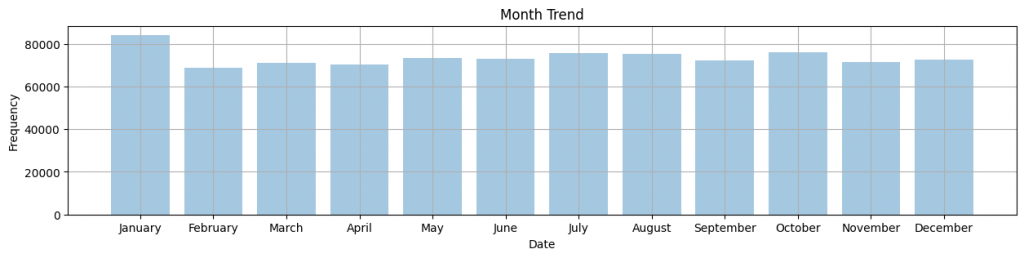
Crime Type Distribution
- What are the most common types of crimes reported in the dataset?
ndf = df[ ['Crm Cd','Crm Cd Desc'] ].value_counts().reset_index().head(10)

# plt.figure(figsize=(15,3))
plt.barh(ndf['Crm Cd Desc'],ndf['count'],alpha=0.4)
plt.title('Most Common Crime')
plt.xlabel('Date')
plt.ylabel('Frequency')
plt.grid()
plt.xticks(rotation=45)
plt.show()

Now let me give you few tasks for you to continue this Data Science Project Onwards :
Data Science Project Questions : Try to solve these questions and complete this data science project.
- What is the total number of reported crimes in this dataset?
- How many different types of crimes are reported?
- What is the most common type of crime?
- How many crimes involve victims of each gender?
- What is the distribution of crimes by victim age?
- What is the distribution of crimes by victim descent?
- What time of day do most crimes occur?
- Are there any noticeable trends or patterns in the occurrence of crimes over the reported dates?
- Which area reports the highest number of crimes?
- Is there any correlation between the time of day and the type of crime reported?
- How many crimes involve stolen vehicles?
- What percentage of crimes involve theft of identity?
- What are the top three premises where crimes occur most frequently?
- What weapons are most commonly used in reported crimes?
- How many crimes result in arrests?
- Are there any seasonal trends in the occurrence of certain types of crimes?
- What are the average latitude and longitude coordinates of reported crimes?
- Is there any correlation between the victim’s age and the type of crime reported?
- How many crimes occur at bus stops?Are there any significant differences in the demographics of victims across different types of crimes?
- How many crimes involve theft from vehicles?
- What percentage of crimes occur at multi-unit dwellings?
- How many crimes involve theft from clothing stores?
- Is there any relationship between the location of reported crimes and their outcome (e.g., arrest or investigation)?
- What is the average age of victims for each type of crime?
- Are there any outliers in terms of the reported date and time of the occurrence?
- What percentage of crimes occur on the street?How many crimes involve grand theft?
- Is there any correlation between the location of reported crimes and the type of premises where they occur?
- How does the frequency of reported crimes vary across different months or days of the week?
Conclusion for this Data Science Project:
The exploratory data analysis (EDA) of the crime dataset in this Data Science Project revealed insightful patterns and trends. Spatially, specific areas with the highest and lowest crime rates were identified, aiding in targeted prevention efforts. Temporally, the analysis delved into monthly and weekly variations in Data Science Project, offering a nuanced understanding of temporal crime dynamics.
The investigation of prevalent crime types and victim demographics provided in this Data Science Project valuable information for law enforcement strategies. Premises associated with reported crimes were examined, shedding light on potential hotspots.
Additionally, in this data science project study delved into the frequency and types of weapons used in crimes, contributing to a comprehensive overview. The analysis of investigation statuses highlighted the effectiveness of law enforcement actions. Geospatial correlations between crime types and demographics were explored in Data Science Project, providing context to the observed patterns. The project concluded with actionable insights, emphasizing the need for further studies and collaboration with stakeholders to enhance public safety strategies.
To Learn Data Science and Data Science Projects From Scratch and get your First Job In Data Science, Go through Console Flare. We are under Top 10 Promising Data Science Institute in India.
You can also Download our Brochure From here and go through few more data science project: