Load Data Before Practicing:
Matplotlib for Data Visualization
Learn how to create compelling data visualizations in Python with this Matplotlib full tutorial. From basics to advanced techniques, get started today.
Matplotlib is a popular Python library for creating static, interactive, and animated visualizations. This tutorial covers the essential aspects of Matplotlib, with examples and code that you can easily use for your projects.
Table of Contents
- Introduction to Matplotlib
- Basic Plotting with Matplotlib
- Customizing Plots
- Creating Advanced Charts
- Tips for Matplotlib in Data Science
1. Introduction to Matplotlib
Matplotlib provides extensive tools for visualizing data, from basic line and scatter plots to complex visualizations. We’ll start with setting up a simple plot using data from tips and retail sales datasets.
2. Basic Plotting with Matplotlib
Let’s start with simple line and bar charts.
Example 1: Line Chart
A line chart is great for visualizing trends over time. Here, we use the retail sales data to plot sales across different months.
import matplotlib.pyplot as plt

# Plotting sales data for 2023 and 2024
months = retail_sales_2023_df['Month']
sales_2023 = retail_sales_2023_df['sales']
sales_2024 = retail_sales_2024_df['sales']

plt.figure(figsize=(10, 5))
plt.plot(months, sales_2023, label='2023 Sales', marker='o')
plt.plot(months, sales_2024, label='2024 Sales', marker='s')
plt.xlabel('Month')
plt.ylabel('Sales')
plt.title('Monthly Retail Sales for 2023 and 2024')
plt.legend()
plt.xticks(rotation=45)
plt.show()
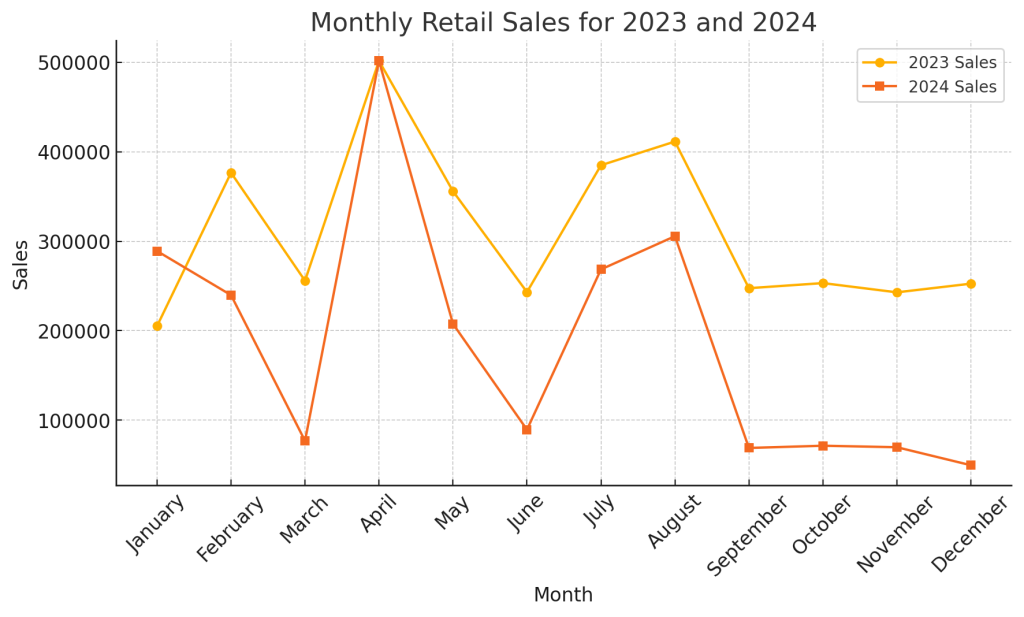
This code generates a line chart comparing retail sales for 2023 and 2024. It’s a straightforward way to track monthly trends.
Example 2: Bar Chart
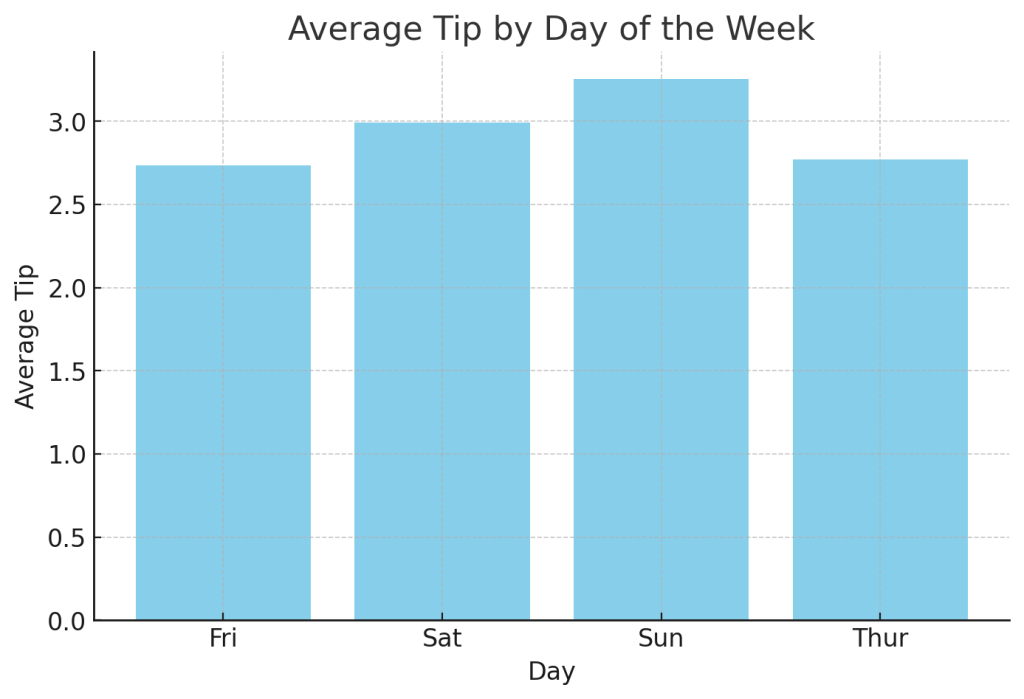
Bar charts are effective for comparing categories. Here’s a bar chart showing the average tip amount for each day of the week based on our tips dataset.
import numpy as np

# Calculate average tip by day
avg_tip_by_day = tips_df.groupby('day')['tip'].mean()

plt.figure(figsize=(8, 5))
plt.bar(avg_tip_by_day.index, avg_tip_by_day.values, color='skyblue')
plt.xlabel('Day')
plt.ylabel('Average Tip')
plt.title('Average Tip by Day of the Week')
plt.show()
3. Customizing Plots
Matplotlib offers various customization options. You can change colors, add grids, and much more to enhance your visuals.
Example: Customizing Line Colors and Adding Grids
plt.figure(figsize=(10, 5))
plt.plot(months, sales_2023, color='blue', linestyle='--', label='2023 Sales')
plt.plot(months, sales_2024, color='red', linestyle='-', label='2024 Sales')
plt.xlabel('Month')
plt.ylabel('Sales')
plt.title('Customized Monthly Retail Sales for 2023 and 2024')
plt.legend()
plt.grid(True)
plt.xticks(rotation=45)
plt.show()
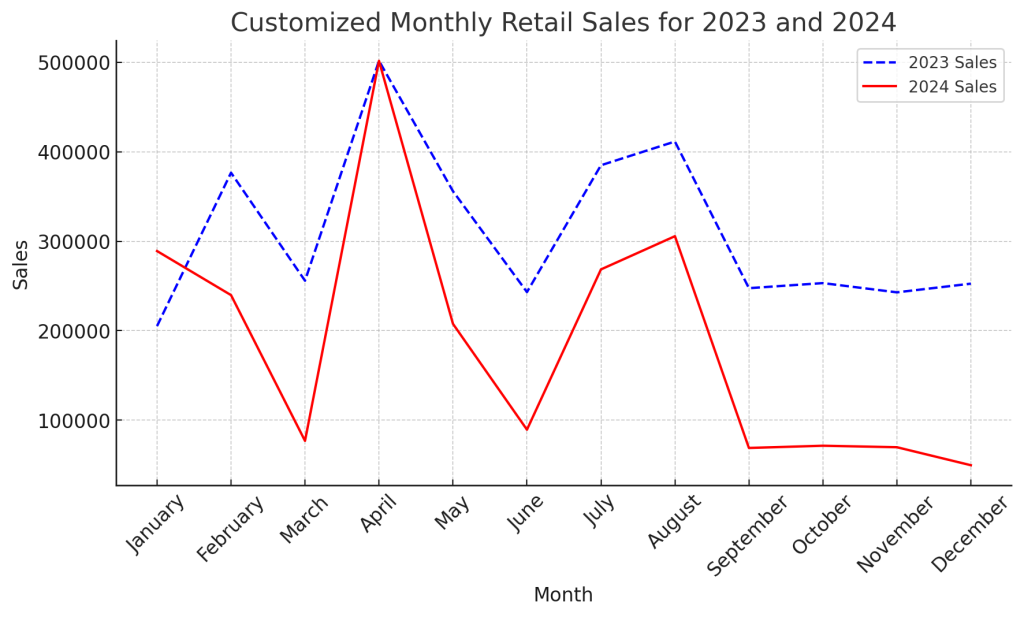
In this chart, we’ve customized the line colors and styles and added a grid for better readability.
4. Creating Advanced Charts
Scatter Plot
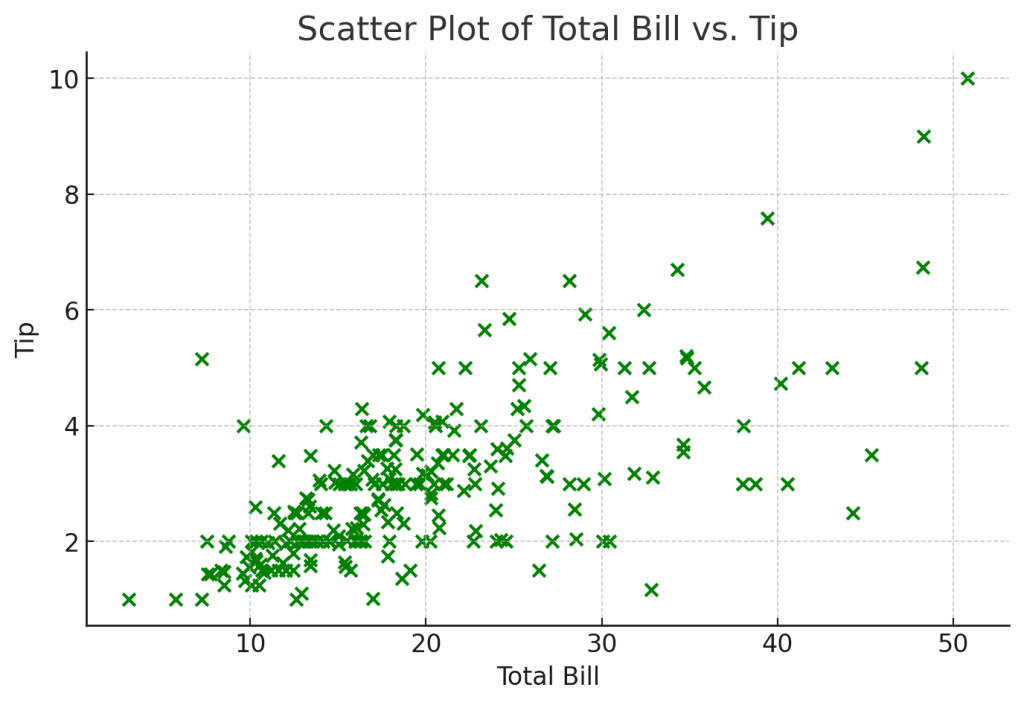
Scatter plots are excellent for examining the relationship between two numerical variables. Here, we’ll create a scatter plot to explore the relationship between total_bill and tip in our tips dataset.
plt.figure(figsize=(8, 5))
plt.scatter(tips_df['total_bill'], tips_df['tip'], c='green')
plt.xlabel('Total Bill')
plt.ylabel('Tip')
plt.title('Scatter Plot of Total Bill vs. Tip')
plt.show()
Pie Chart
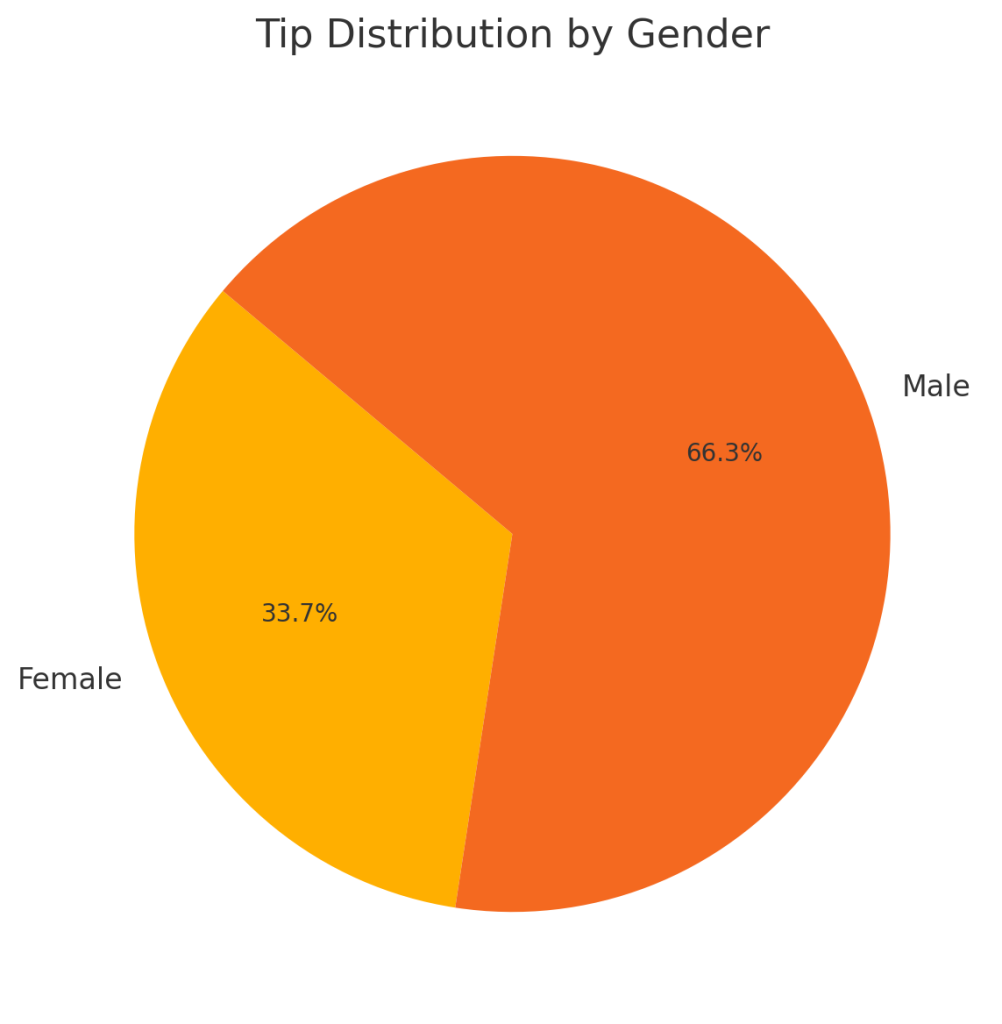
Pie charts are helpful for displaying proportions. Here’s a pie chart showing the distribution of tips by gender.
# Calculate tip proportion by gender
tip_by_gender = tips_df.groupby('gender')['tip'].sum()

plt.figure(figsize=(7, 7))
plt.pie(tip_by_gender, labels=tip_by_gender.index, autopct='%1.1f%%', startangle=140)
plt.title('Tip Distribution by Gender')
plt.show()
5. Tips for Matplotlib in Data Science
- Experiment with Styles: Matplotlib offers various styles like
ggplot,seaborn, etc., that can instantly enhance the look of your charts. - Use Subplots: Display multiple plots in one figure with subplots, useful for data comparison.
- Save Your Plots: Use
plt.savefig('filename.png')to save your plots as image files.
Conclusion
Matplotlib is a versatile tool for data visualization in Python. From basic to advanced charts, it provides a wide range of options for data storytelling. By mastering Matplotlib, you can create compelling visualizations that effectively communicate your data insights.
At ConsoleFlare, we specialize in equipping students from diverse backgrounds with the skills to excel in data science and analytics. Through our comprehensive training, we ensure that students not only learn essential tools like Matplotlib but also develop the expertise to use these tools effectively in real-world scenarios. Join ConsoleFlare today to start your journey in data science and bring your data insights to life with powerful visualizations!


