In today’s data-driven world, the ability to extract valuable insights from vast amounts of information is becoming increasingly important. Python, a versatile programming language, has emerged as a popular tool for data analysis due to its simplicity, flexibility, and rich ecosystem of libraries.
In this article, we will explore the world of data analysis using Python, compare it with R, and discover how you can get started on your journey to becoming a data analyst.
Why Data Analysis Using Python?
Python offers numerous advantages when it comes to data analysis. Its user-friendly syntax allows beginners to quickly grasp the fundamentals, while its extensive library ecosystem, including powerful tools such as NumPy, Pandas, and Matplotlib, provides the necessary functionality for efficient data manipulation, exploration, and visualization.
Python’s versatility enables seamless integration with other programming languages, databases, and big data frameworks, making it an ideal choice for handling diverse datasets and complex analytics tasks.
Python vs. R: A Brief Comparison
When it comes to data analysis, Python and R are two prominent languages that often compete for attention. While R has traditionally been the go-to language for statistical computing and graphics, Python has gained popularity for its general-purpose capabilities and ease of use. Python’s vast community and industry support have led to the development of numerous data analysis libraries, enabling users to perform a wide range of tasks without relying on external packages.
Python’s clear advantage lies in its versatility. With Python, you can not only perform statistical analysis but also integrate data analysis within larger software systems, build web applications, and create machine learning models. R, on the other hand, excels in statistical analysis and has a comprehensive set of built-in statistical functions and packages. Choosing between Python and R depends on your specific needs, but learning Python for data analysis provides a broader skill set that can be applied to various domains.
You’re reading the article, Data Analysis using Python and R for Absolute Beginner.
Getting Started with Data Analysis using Python
To embark on your data analysis journey with Python, there are a few essential steps to follow:
- Learn the basics of Python: Familiarize yourself with the fundamentals of the Python programming language. Understand variables, data types, control structures, and functions.
- Master data manipulation with Pandas: Pandas is a powerful library that provides data structures and functions for efficient data manipulation. Learn how to load, clean, filter, and transform data using Pandas.
- Explore data visualization with Matplotlib and Seaborn: Data visualization is crucial for gaining insights and communicating findings effectively. Matplotlib and Seaborn are widely used libraries for creating insightful charts, graphs, and plots.
- Understand statistical analysis with SciPy and StatsModels: Python offers libraries such as SciPy and StatsModels that provide a comprehensive set of statistical functions. Learn how to perform hypothesis testing, regression analysis, and more.
- Dive into machine learning with Scikit-learn: Python’s Scikit-learn library is a powerful tool for implementing machine learning algorithms. Gain hands-on experience with data preprocessing, model training, and evaluation.
You’re reading the article, Data Analysis using Python and R for Absolute Beginner.
Conclusion
Python has established itself as a leading language for data analysis due to its simplicity, versatility, and extensive library ecosystem. Whether you are a beginner or an experienced programmer, learning Python for data analysis opens up a world of possibilities. With its intuitive syntax and vast community support, Python enables you to perform a wide range of data analysis tasks efficiently and effectively.
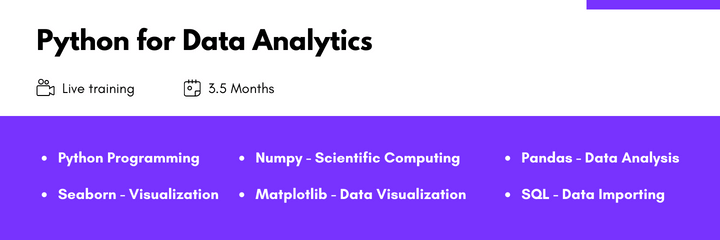
If you’re looking to enhance your data analysis skills and earn a certification, consider the Python for Data Analytics certification course by ConsoleFlare. This comprehensive online course provides in-depth knowledge and practical exercises to help you become proficient in Python for data analysis. Visit ConsoleFlare’s website to learn more and take your data analysis skills to the next level.
Remember, the world of data analysis is constantly evolving, and Python offers a solid foundation for staying ahead in this dynamic field. So, dive in and explore the endless possibilities of data analysis using Python!
Hope you liked reading the article, Data Analysis using Python and R for Absolute Beginner. Please share your thoughts in the comments section below.
Follow our social media pages: Facebook, Instagram, LinkedIn


