Numpy is a very useful library. It stands for Numerical Python. In this blog, I will cover everything you need to know to use NumPy.
It is a package used for Scientific Calculation for Python. Calculations are an integral part when analyzing the dataset. Simple mean, median or standard deviations are something that is used quite often in Datasets.
But can’t we calculate using Python? So yes you can, but it will only slow you down.
Why Should We Use Numpy ?
It is Fast :
It is written in C, and it is really fast. Let’s say if it takes you 100 days to calculate something, with the help of NumPy, It will take a single day. Isn’t it Fantastic? Let me show you:

Python lists and loops took 152 milliseconds while NumPy took 1.6
Ease Of Use :
You can write small, concise, and intuitive mathematical expressions like np. dot() rather than using loops.
Let’s Dive in Numpy and its Functions:
It is used in many fields such as :

But you will be using statistical computing more than anything else as a Data Analyst.
A Simple Project using Numpy:
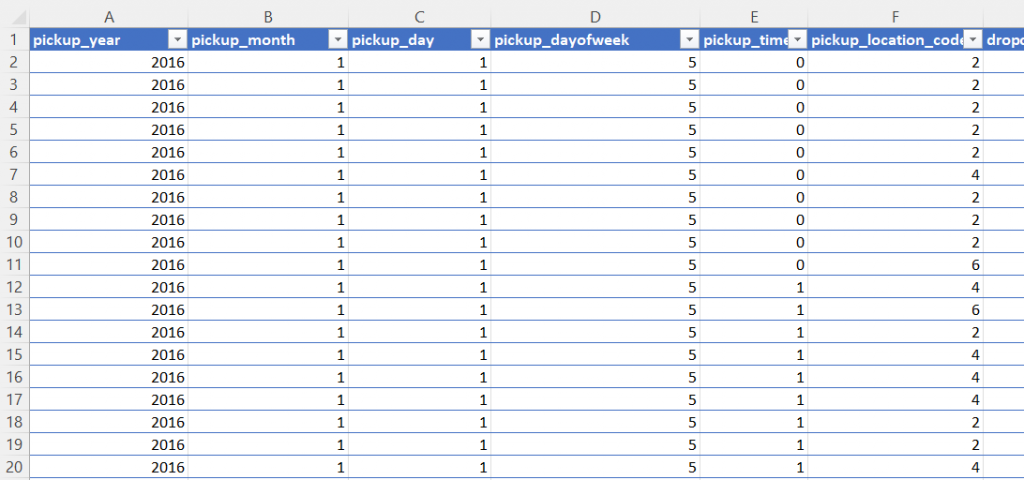
Before We go ahead , Download This CSV file , so that we can analyze it. It is Data of New York Taxis and it looks something like this :

Step 1 :
Generating Matrix/Array with the help of Numpy:
taxi_data = np.genfromtxt('nyc_taxis.csv',delimiter=',',skip_header=True)
How many rides were ever recorded ?
taxi_data.shape[0]
Average Tip Given To Drivers:
Index Number of Column tip_amount is 12, so we need to slice the whole column:
taxi_data[:,12]Output:
array([11.65, 8. , 0. , ..., 5. , 8.95, 0. ])
Average :
taxi_data[:,12].mean()
Output :
5.814489169271996
Tips That were more than 50 Dollars :
tip_amount = taxi_data[:,12]
fifty = tip_amount>50
tip_amount[fifty]
Output :
array([ 52.8 ,  60.  ,  59.34,  80.  ,  70.  ,  60.  ,  55.  ,  65.  ,
        80.  ,  62.  , 100.  ,  58.  ,  62.  ,  75.7 ,  60.  ,  70.  ])
Number Of Online Payments Vs Cash Payments:
So before coding, let me tell you , as you can see , Last column is Payment type and it has two values:
1 means Cash Payment
2 means Online Payments
online_payments = taxi_data[:,-1]==1
online_payments.sum()
Output :
64356
cash_payments = taxi_data[:,-1]==2
cash_payments.sum()
Output:
24520
Longest Trip Distance Ever Recorded:
trip_distance = taxi_data[:,7]
maximum_distance = max(trip_distance)
maximum_distance
Output :
182.9Fare of Longest Trip :
trip_distance = taxi_data[:,7]
maximum_distance = max(trip_distance)
index_of = np.where(trip_distance==182.9)
fare_amount = taxi_data[:,9]
fare_amount[index_of]
Output :
2.5So these are few analysis, you can perform with the help of Numpy.


One thought on “How To Use Numpy For Analysing The Data”