Data Visualization with Seaborn: 7 Steps Guide to Create Scatter Plot
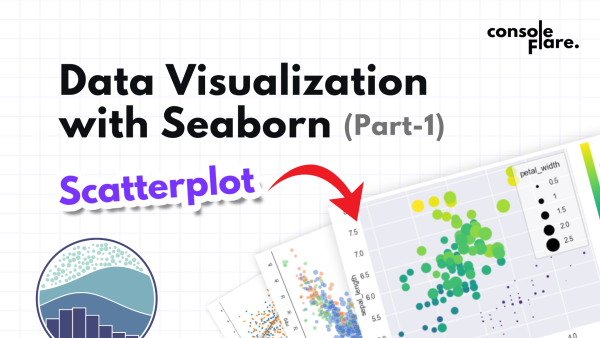
In today’s world, data is more than just numbers—it’s a story waiting to be told. With tools like Python and Seaborn, you can transform raw data into visually appealing and insightful plots that help you make data-driven decisions. This blog walks you through a hands-on example of creating a professional scatter plot using Pandas, Seaborn,…
Power BI vs Tableau: Which Should You Choose in 2023?
Power BI vs Tableau In the rapidly evolving world of data analytics and business intelligence (BI), choosing the right tool is crucial for organizations seeking to unlock the full potential of their data. Two popular contenders in this arena are Microsoft’s Power BI and Tableau. In this article, we will compare Power BI and Tableau…
6 Powerful Python Data Visualization Tools & Techniques
Python, a popular programming language for data analysis and machine learning, offers a range of powerful data visualization tools & techniques. Data visualization is the process of representing data and information in a graphical or visual format. It involves creating visual representations of data to help people better understand and interpret information. The goal of…
What is Business Intelligence & how can it help in amazing career growth?
Business Intelligence, often referred to as BI, is an umbrella that consists of tools, processes, and technologies to analyze, and process data in order to gather insights & optimize business performance.


