Netflix Data Analysis:
Netflix has always been a data-driven company since its reception.Netflix uses data to extract insights and use them in improving their services.
Let us do a simple project with the help of pandas to answer some questions of Netflix Data.
Download data from here :
Import Libraries
import pandas as pd
import seaborn as sns
Import Dataset
netflix = pd.read_csv(r"C:\Users\abhis\Downloads\netflix.csv")
netflix
Sno | show_id | type | title | director | cast | country | date_added | rating | duration | listed_in | Description | |
|---|---|---|---|---|---|---|---|---|---|---|---|---|
| 0 | s1 | Movie | Dick Johnson Is Dead | Kirsten Johnson | NaN | United States | September 25, 2021 | PG-13 | 90 min | Documentaries | As her father nears the end of his life, filmm… | |
| 1 | s1 | Movie | Dick Johnson Is Dead | Kirsten Johnson | NaN | United States | September 25, 2021 | PG-13 | 90 min | Documentaries | As her father nears the end of his life, filmm… | |
| 2 | s2 | TV Show | Blood & Water | NaN | Ama Qamata, Khosi Ngema, Gail Mabalane, Thaban… | South Africa | September 24, 2021 | TV-MA | 2 Seasons | International TV Shows, TV Dramas, TV Mysteries | After crossing paths at a party, a Cape Town t… | |
| 3 | s3 | TV Show | Ganglands | Julien Leclercq | Sami Bouajila, Tracy Gotoas, Samuel Jouy, Nabi… | NaN | September 24, 2021 | TV-MA | 1 Season | Crime TV Shows, International TV Shows, TV Act… | To protect his family from a powerful drug lor… |
You are reading netflix data analysis.
Simple Analysis
Top 5 Records
netflix.head()
Last 5 Records:
netflix.tail()

shape of Dataset
netflix.shape
(8810, 11)
Size – Total number of elements (Values) in the dataset
netflix.size
96910
Column names:
netflix.columns
Index(['show_id', 'type', 'title', 'director', 'cast', 'country', 'date_added',
       'rating', 'duration', 'listed_in', 'description'],
      dtype='object')
dtypes:
netflix.dtypes
Out[8]:
show_id        object
type           object
title          object
director       object
cast           object
country        object
date_added     object
rating         object
duration       object
listed_in      object
description    object
dtype: object
Info
print(netflix.info())
<class 'pandas.core.frame.DataFrame'>
RangeIndex: 8810 entries, 0 to 8809
Data columns (total 11 columns):
 #   Column       Non-Null Count  Dtype
---  ------       --------------  -----
 0   show_id      8810 non-null   object
 1   type         8810 non-null   object
 2   title        8810 non-null   object
 3   director     6176 non-null   object
 4   cast         7984 non-null   object
 5   country      7977 non-null   object
 6   date_added   8800 non-null   object
 7   rating       8806 non-null   object
 8   duration     8807 non-null   object
 9   listed_in    8810 non-null   object
 10  description  8810 non-null   object
dtypes: object(11)
memory usage: 757.2+ KB
None
Is there any duplicate Records,if yes then Remove Duplicate Records .
You are reading netflix data analysis.
To check Duplicate Records
netflix[netflix.duplicated()]
Remove Duplicate Records
netflix.drop_duplicates(inplace = True)
Is there any null-value in our dataset ? Show with heatmap
isnull()
netflix.isnull()

You are reading netflix data analysis.
Count null values
netflix.isnull().sum()
show_id           0
type              0
title             0
director       2634
cast            825
country         831
date_added       10
rating            4
duration          3
listed_in         0
description       0
dtype: int64
Heatmap
sns.heatmap(netflix.isnull())

For ‘Squid Game’ , What is the showid and director of the show ?
To check if Squid Game in title
In [15]:
netflix.loc[netflix['title']=='Squid Game']

netflix[netflix['title'].isin(['Squid Game'])]
netflix[netflix['title'].str.contains('Squid Game')]

In which year the highest number of tv shows and movies are released? Show with Bar Graph
To perform an operation on date_added, we must first check its data type, and if it is not in DateTime, we should convert it.
Convert it into DateTime:
netflix['date_added'].dtypesdtype('O')
netflix['date_added'] = pd.to_datetime(netflix['date_added'])
netflix['date_added'].dtypes
2019.0 2016 2020.0 1879 2018.0 1649 2021.0 1498 2017.0 1188 2016.0 429 2015.0 82 2014.0 24 2011.0 13 2013.0 11 2012.0 3 2009.0 2 2008.0 2 2010.0 1 Name: date_added, dtype: int64
Bar Graph
netflix['date_added'].dt.year.value_counts().plot(kind='bar')
How many movies and tv shows are in this dataset, Show with Graph?
groupby
netflix.groupby('type')['type'].count()type Movie 6131 TV Show 2676 Name: type, dtype: int64
Bar Graph:
sns.countplot(netflix['type'])
Show all the movies that were released in year 2021
Create a column ‘Release year’:
netflix['release year'] = netflix['date_added'].dt.year
netflix['release year']
0 2021.0
2 2021.0
3 2021.0
4 2021.0
5 2021.0
...
8805 2019.0
8806 2019.0
8807 2019.0
8808 2020.0
8809 2019.0
Name: release year, Length: 8807, dtype: float64
netflix.loc[(netflix['release year']==2021) & (netflix['type']=='Movie'),['title']]
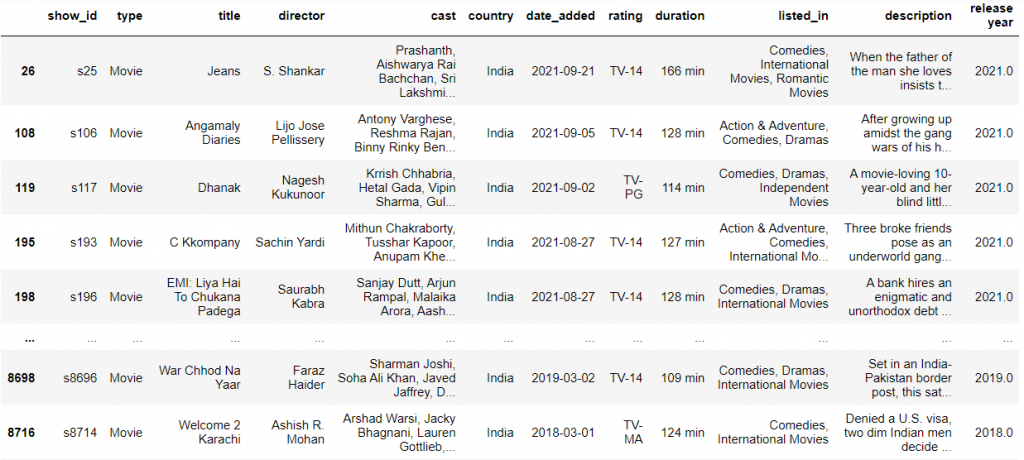
Show only the titles of Movies released in india only
netflix.loc[(netflix['type']=='Movie') & (netflix['country']=='India'),['title']]
Show top 10 directors who gave most Shows and movies ever .
netflix['director'].value_counts()[:10]Rajiv Chilaka 19 Raúl Campos, Jan Suter 18 Marcus Raboy 16 Suhas Kadav 16 Jay Karas 14 Cathy Garcia-Molina 13 Martin Scorsese 12 Youssef Chahine 12 Jay Chapman 12 Steven Spielberg 11 Name: director, dtype: int64
Show all the records of Indian Comedy Movies
netflix.loc[(netflix['country']=='India') & (netflix['listed_in'].str.contains('Comedies')) & (netflix['type']=='Movie')]
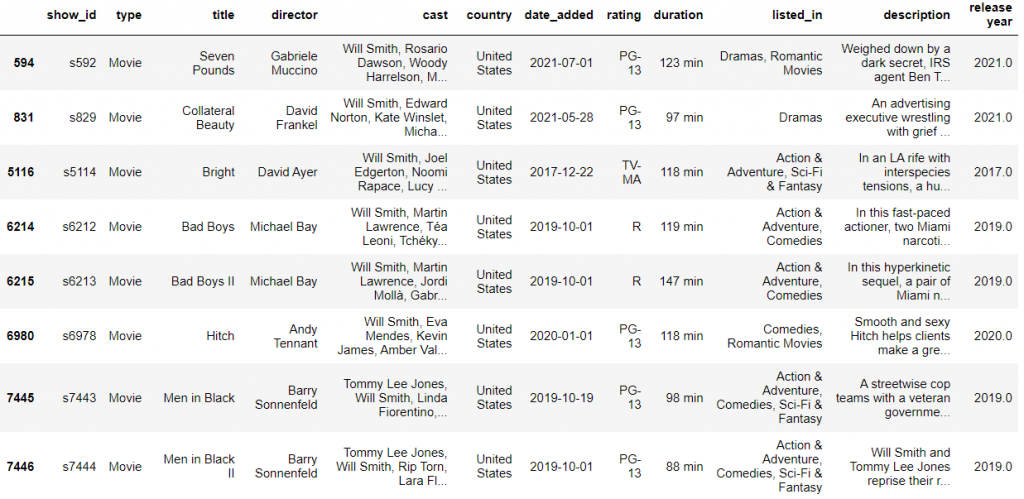
In how many movies ‘Will Smith’ is cast ?
netflixx = netflix.dropna()
netflixx.loc[netflixx['cast'].str.contains('Will Smith')]
netflixx.loc[netflixx['cast'].str.contains('Will Smith')]['cast'].count()10
What are the different ratings defined by netflix ?
netflix['rating'].nunique()
17
How many movies got TV-14 rating in india in 2021?
netflix.loc[(netflix['rating']=='TV-14') & (netflix['country']=='India') & (netflix['release year']==2021) & (netflix['type']=='Movie')]
You are reading netflix data analysis.
How many TV Shows got the ‘R’ rating, after year 2018 ?
netflix.loc[(netflix['type']=='TV Show') & (netflix['rating']=='R') & (netflix['release year']>2018)]
You are reading netflix data analysis.
Conclusion:
Netflix, a giant streaming platform has made it big using big data analytics. Netflix is one of the most prominent examples of how advancements in technology have helped brands like Netflix to grow into becoming famous and successful. It is not only Netflix that is making use of big data analytics like Amazon.
Learn to analyze data like never before . We have placed many students with our well structure course and guided learning.
Check here : Best Data Analytics Course with Python – Consoleflare


Just a smiling visitor here to share the love (:, btw great layout.