Microsoft Excel is a highly used tool across all industries in every sector for data entry, reporting, and visualization purposes. It becomes more powerful with add-ins that enhance its functionality.
From statistical analysis and hypothesis testing to regression and ANOVA. You can transform Excel into a strong data analytics tool with a built-in extension. Here in this article, you will explore the Excel Data Analysis Toolpak and its installation along with the features.
What is the Data Analysis Toolpak in Excel?
The Data Analysis Toolpak in Excel is like a built-in toolkit to process complex statistical tasks without using extra software. Students, analysts, and marketers who work with large datasets or require detailed calculations highly use it in their work. With it, you can easily create histograms, perform regressions, analyze correlations, generate random numbers, and even conduct t-tests or ANOVA—everything you get in one place in a single click.
How to Enable the Data Analysis Toolpak?
If you’re using Excel for Microsoft 365, Excel 2021, 2019, or earlier versions like 2016 and 2013, enabling the Toolpak is easy:
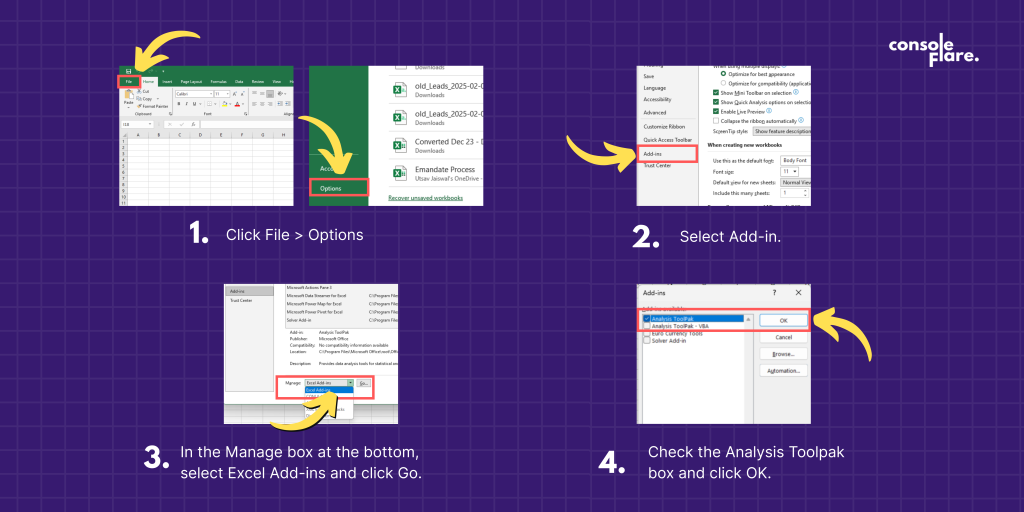
- Click File > Options.
- Select Add-ins.
- In the Manage box at the bottom, select Excel Add-ins and click Go.
- Check the Analysis Toolpak box and click OK.
After enabling, you’ll find the Data Analysis button under the Data tab.
Why Use the Data Analysis Toolpak?
The Toolpak is especially useful because it eliminates the need for external tools like R, SPSS, or Python for basic and intermediate data analysis. Here you will understand why it is widely used in various industries :
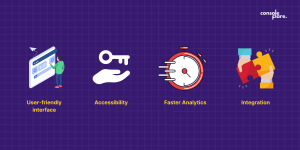
- User-friendly interface: coding is not required; just follow the step-by-step dialog box.
- Accessibility: It comes bundled with Excel, meaning there are no extra costs.
- Speed: You can process large datasets for basic analyses with speed.
- Integration: Directly works with existing Excel data without exporting from anywhere.
Core Features of the Data Analysis Toolpak
Data Analysis Toolpak serves as an essential tool to summarize and interpret data in a proper way in “Descriptive Statistics.” You can calculate mean, median, mode, standard deviation, and variance. It also finds the minimum and maximum values and computes the range, sum, and count of the data points. You can get an overview of the data. These statistics are important for finding trends, understanding variability, and making informed decisions.
In data analysis, “correlation” is important to find how two factors are related to each other. Their link can be positive, negative, or neutral, or they are not connected to each other.
By analyzing the historical data with the help of a “regression” model, you can predict future values. For example, you can use it to estimate future sales based on how much money you spend on ads or how much you charge for your products.
“t-Test (Student’s t-Test)” is used to compare two groups by the three T types by comparing the same group in two conditions, two samples with equal variances (similar spread of data), and two samples with unequal variances (different spread of data). By analyzing the difference, you can make better decisions.
“ANOVA,” or analysis of variance, is a statistical tool used to compare more than two groups to find the difference. It is of three types: single-factor, two-factor with replication, and two-factor without replication.
“Histogram” is a graph that shows how data is distributed in a range. Visual representation helps you to quickly understand data frequencies and identify key insights.
The “moving average” is a technique to find the underlying patterns in the time-series datasets.
Through the “Rank and Percentile,” you can rank the data points to evaluate the performance.
Also Read: Mastering Lookup Functions in Excel: HLOOKUP, XLOOKUP and VLOOKUP Excel
Best Practices When Using the Toolpak
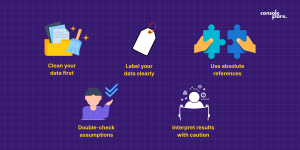
- Clean your data first: You can clean the data by removing blank cells, duplicates, or text in numeric columns.
- Label your data clearly: It is helpful when you select input/output ranges.
- Use absolute references: When performing multiple analyses, to avoid errors.
- Double-check assumptions: Ensure your data meets the assumptions for the chosen test (e.g., normality for t-tests).
- Interpret results with caution: Always understand the context of your results—statistical significance doesn’t always mean practical importance.
Limitations of the Data Analysis Toolpak
Although the Data Analysis Toolpak is versatile and user-friendly, it also has some limitations. You can not update the result automatically if the data gets changed. It also has limited visualization options.
Conclusion:
Data Analysis Toolpak is widely used for data analysis; that is a very lucrative career option nowadays. There are a number of opportunities with various job roles. You can learn data analysis by enrolling yourself with Console Flare, where you will learn all the essential skills from industry experts with strong placement support.
For more such content and regular updates, follow us on Facebook, Instagram, LinkedIn