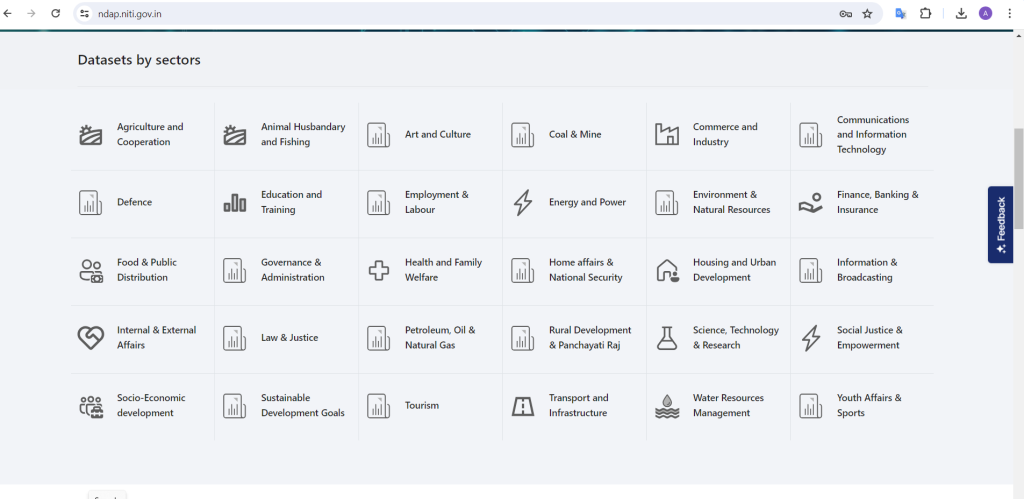
Data Analysis has become a basic requirement of any country’s government to collect, track, and analyze data so that they can make data-dependent decisions that can be quick, accurate, and provide faster results. Governments of any country follow these steps in every sector. In the same manner, the government of India collects data for every sector and analyzes it from time to time, and also the data is available publicly. You can check it, download it, and perform analysis for learning purposes.
If you wish to learn more about Data Analysis and Data Science and have an in-depth knowledge of this field. Read this blog
What Is Data Science In Simple Words?
In today’s blog, we are going to download a dataset from the healthcare sector
Data on district-wise healthcare infrastructure pertaining to the availability of healthcare centers in India is published in the annual Rural Health Statistics. Rural Health Statistics is an effort towards providing reliable and updated information on rural health infrastructure, which would cater to the basic needs of effective planning, monitoring, and management of health infrastructure.
Let us start the data analysis from the basics:
- Importing necessary libraries:
import pandas as pd
import seaborn as sns
import matplotlib.pyplot as pltPandas is a library, used for analyzing the data
Plotly, Seaborn, and Matplotlib are the libraries used for data visualization
2. Read the file: We need to access the file with the help of pandas.
data=pd.read_csv('ndap-healthcare.csv')Comprehensive Data Analysis of Primary Health Centre Distribution in Indian States
3. Basic Information: Number of rows and columns the dataset has and data type of each column.
data = pd.read_csv('ndap-healthcare.csv')
rows,columns=data.shape

print(f'Number of rows:{rows}')
print(f'Number of columns:{columns}')

data_types = data.dtypes
print(data_types)

# Output
Number of rows: 716
Number of columns: 12


srcStateName                                                      object
srcDistrictName                                                   object
Functional Sub Centres                                           float64
Functional Primary Health Centres                                  int64
Functional Community Health Centres                                int64
Functional Health and Wellness Centres-Sub Centres               float64
Functional Health and Wellness Centres-Primary Health Centres    float64
Functional Sub Divisional Hospitals                              float64
Functional District Hospitals                                    float64
srcYear                                                           object
YearCode                                                           int64
Year objectdata is a variable that holds the data from the CSV file.
data.shape: This command provides the number of rows and columns present in the file.
data.dtypes: This command provides the data type of each column.
4. Statistical Description: What is the mean, median, percentile, and count for the columns?
data.desccribe()
Comprehensive Data Analysis of Primary Health Centre Distribution in Indian States
5. Missing Values: Which columns have missing values, and how many missing values are there per column?
missing_values=data.isnull().sum()
print(missing_values)
data.isnull().sum(): Provides the total number of missing values in each column.
For more such content and regular updates, follow us on Facebook, Instagram, LinkedIn
6. Which state has the highest number of functional sub-centers?
state_sub_centres = data.groupby('srcStateName')['Functional Sub Centres'].sum().idxmax()
print(f"The state with the highest number of functional sub-centres is {state_sub_centres}.")

# Output

The state with the highest number of functional sub-centres is Uttar Pradesh.Uttar Pradesh is the state with the highest number of functional sub-centers.
7. How many districts have zero functional health and wellness centers (sub-centers)?
zero_hwsc = data[data['Functional Health and Wellness Centres-Sub Centres'] == 0].shape[0]
print(f"The number of districts with zero functional health and wellness centres (sub-centres) is {zero_hwsc}.")

# Output

The number of districts with zero functional health and wellness centres (sub-centres) is 295.
There are 295 districts in total with no functional health and wellness centers.
Comprehensive Data Analysis of Primary Health Centre Distribution in Indian States
8. Which district has the highest number of functional health and wellness centers (primary health centers)?
district_hwpc = data['Functional Health and Wellness Centres-Primary Health Centres'].idxmax()
highest_hwpc_district = data.loc[district_hwpc, 'srcDistrictName']
print(f"The district with the highest number of functional health and wellness centres (primary health centres) is {highest_hwpc_district}.")

# Output
The district with the highest number of functional health and wellness centres (primary health centres) is East Godavari.
East Godavari is the district with the highest number of functional health and wellness centers(primary health centers)
Comprehensive Data Analysis of Primary Health Centre Distribution in Indian States
9. What is the total number of functional district hospitals in the dataset?
total_district_hospitals = data['Functional District Hospitals'].sum()
print(f"The total number of functional district hospitals is {total_district_hospitals}.")

# Output
The total number of functional district hospitals is 756.0.There are 756 functional district hospitals in total.
10. How many states have more than 100 functional primary health centers?
states_with_100_phc = data.groupby('srcStateName')['Functional Primary Health Centres'].sum()
num_states_100_phc = (states_with_100_phc > 100).sum()
print(f"The number of states with more than 100 functional primary health centres is {num_states_100_phc}.")

# Output

The number of states with more than 100 functional primary health centres is 23.
There are 23 states having more than 100 functional primary health centers.
Comprehensive Data Analysis of Primary Health Centre Distribution in Indian States
11. Which state has the least number of functional health and wellness centers (sub-centers)?
state_least_hwsc = data.groupby('srcStateName')['Functional Health and Wellness Centres-Sub Centres'].sum().idxmin()
print(f"The state with the least number of functional health and wellness centres (sub-centres) is {state_least_hwsc}.")


# Output
The state with the least number of functional health and wellness centres (sub-centres) is Chandigarh.
Chandigarh has the least number of functional health and wellness centers as compared to others.
12. Which state has the most consistent number of functional sub-centers across its districts?
std_sub_centres = data.groupby('srcStateName')['Functional Sub Centres'].std()
most_consistent_state = std_sub_centres.idxmin()
print(f"The state with the most consistent number of functional sub-centres across its districts is {most_consistent_state}.")


# Output
The state with the most consistent number of functional sub-centres across its districts is A& N Islands.
Andaman & Nicobar Islands is the state with the most consistent number of functional sub-centers across its districts.
Comprehensive Data Analysis of Primary Health Centre Distribution in Indian States
14. Which state has the highest and lowest number of functional district hospitals?
# States with highest and lowest functional district hospitals
district_hospitals_per_state = data.groupby('srcStateName')['Functional District Hospitals'].sum()
state_highest_district_hospitals = district_hospitals_per_state.idxmax()
state_lowest_district_hospitals = district_hospitals_per_state.idxmin()

state_highest_district_hospitals, state_lowest_district_hospitals

# Output

'Uttar Pradesh', 'Chandigarh'Uttar Pradesh is the state with the highest number of district hospitals while Chandigarh has the lowest number of district hospitals
13. Compare the number of functional community health centers between two states of your choice.
state1 = 'Andhra Pradesh'
state2 = 'Arunachal Pradesh'

comparison_chc = data[data['srcStateName'].isin([state1, state2])]
sns.boxplot(x='srcStateName', y='Functional Community Health Centres', data=comparison_chc)
plt.title(f'Comparison of Functional Community Health Centres between {state1} and {state2}')
plt.show()
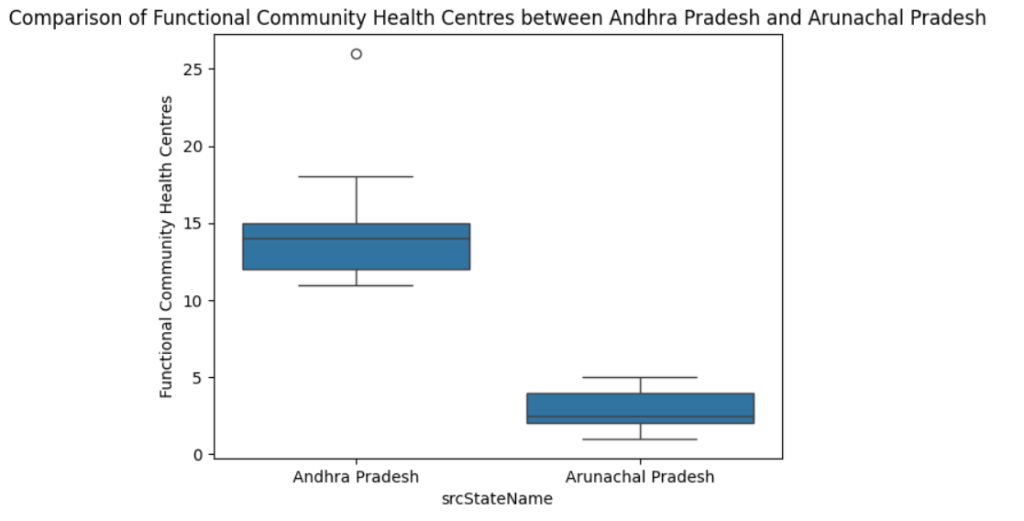
The above graph shows the comparison of Andhra Pradesh and Arunachal Pradesh on behalf of functional community health centers. In case you want to see for other states you can change the values in the variables state1 and state2.
Comprehensive Data Analysis of Primary Health Centre Distribution in Indian States
15. Comparison between states: How do the numbers of different types of functional health centers compare across states? Plot a comparison of the number of functional sub-centers, primary health centers, and community health centers for the top 5 states with the highest values.
# Comparison of different types of functional health centers across states
comparison_data = data.groupby('srcStateName').sum().reset_index()
top_5_states = comparison_data.nlargest(5, 'Functional Sub Centres')

# Plot comparison
fig = px.bar(top_5_states, x='srcStateName', y=['Functional Sub Centres', 'Functional Primary Health Centres', 'Functional Community Health Centres'], title='Comparison of Health Centers in Top 5 States')
fig.show()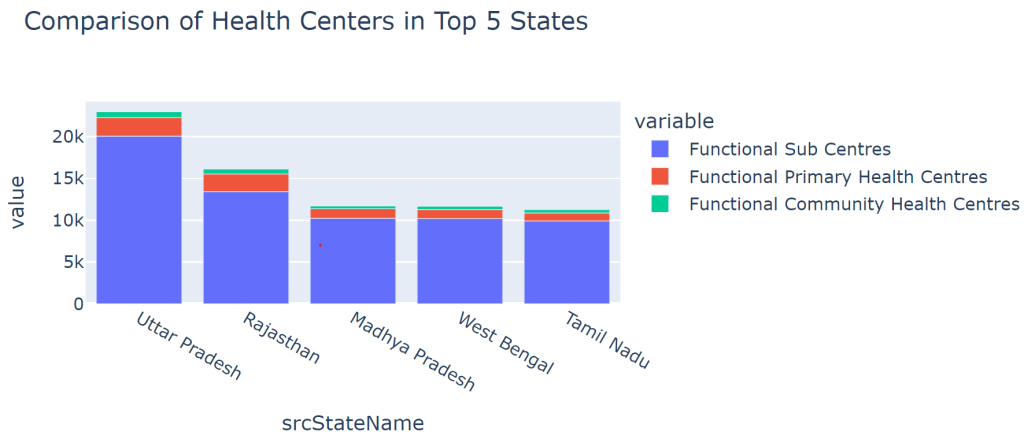
These 5 are the top states with the highest number of functional sub-centers, primary health centers, and community health centers.
16. Plot the total number of functional centers per state.
total_centres_per_state = data.groupby('srcStateName').sum()

plt.figure(figsize=(15, 8))
total_centres_per_state.plot(kind='bar', stacked=True)
plt.title('Total Number of Functional Centres per State')
plt.ylabel('Number of Centres')
plt.xlabel('State')
plt.xticks(rotation=90)
plt.show()
This is the graphical representation of the functional centers for all the states.
Comprehensive Data Analysis of Primary Health Centre Distribution in Indian States
17. What is the average number of functional sub-divisional hospitals per state?
avg_sub_div_hospitals = data.groupby('srcStateName')['Functional Sub Divisional Hospitals'].mean()

plt.figure(figsize=(15, 8))
avg_sub_div_hospitals.plot(kind='bar')
plt.title('Average Number of Functional Sub Divisional Hospitals per State')
plt.ylabel('Average Number')
plt.xlabel('State')
plt.xticks(rotation=90)
plt.show()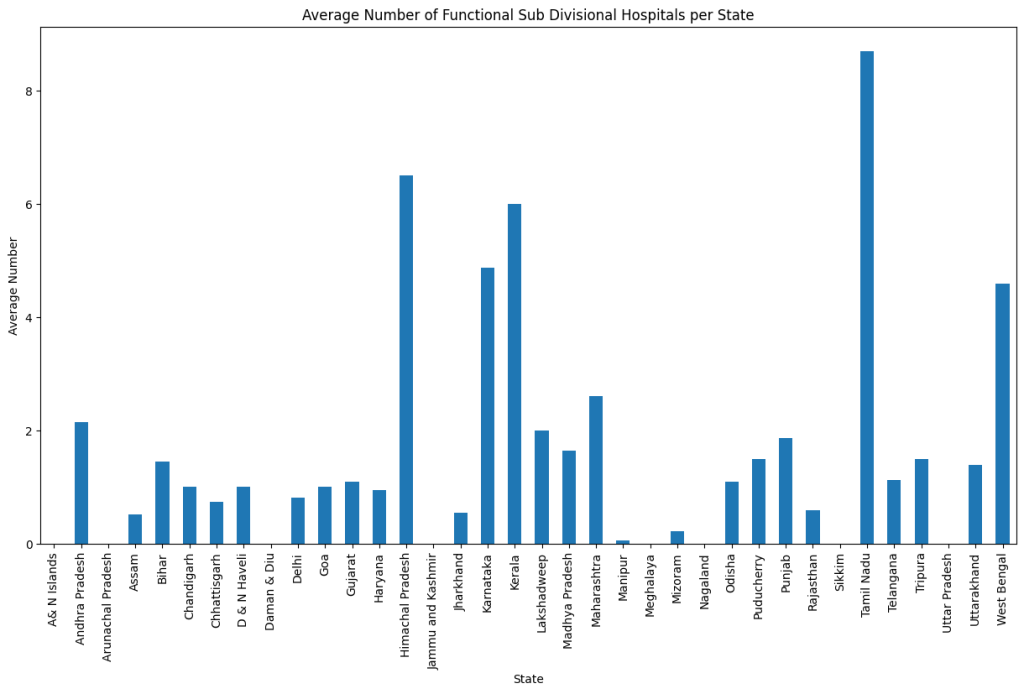
State-wise functional sub-divisional hospital on an average basis.
18. Plot the average number of functional community health centers per state.
state_avg_chc = data.groupby('srcStateName')['Functional Community Health Centres'].mean()

plt.figure(figsize=(15, 8))
state_avg_chc.plot(kind='bar')
plt.title('Average Number of Functional Community Health Centres per State')
plt.ylabel('Average Number')
plt.xlabel('State')
plt.xticks(rotation=90)
plt.show()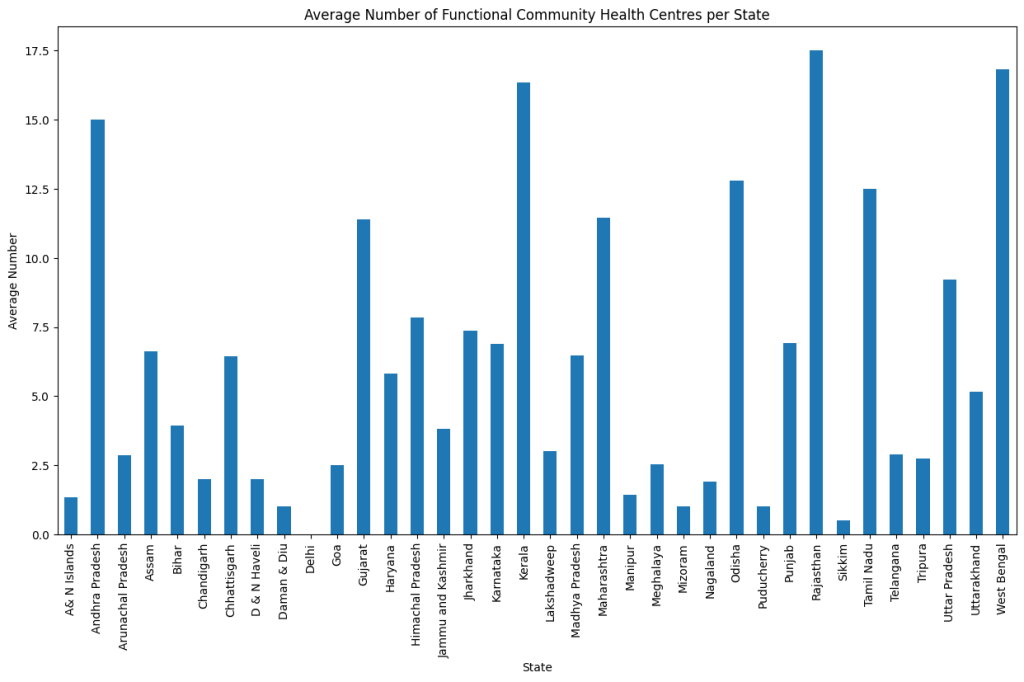
19. What is the distribution of functional primary health centers across different states?
state_phc_counts = data.groupby('srcStateName')['Functional Sub Centres'].sum().sort_values()

# Plot the bar plot
plt.figure(figsize=(15, 10))
sns.barplot(x=state_phc_counts.values, y=state_phc_counts.index, palette='viridis')
plt.title('Distribution of Functional Sub Centres across States')
plt.xlabel('Number of Functional Sub Centres')
plt.ylabel('State')
plt.show()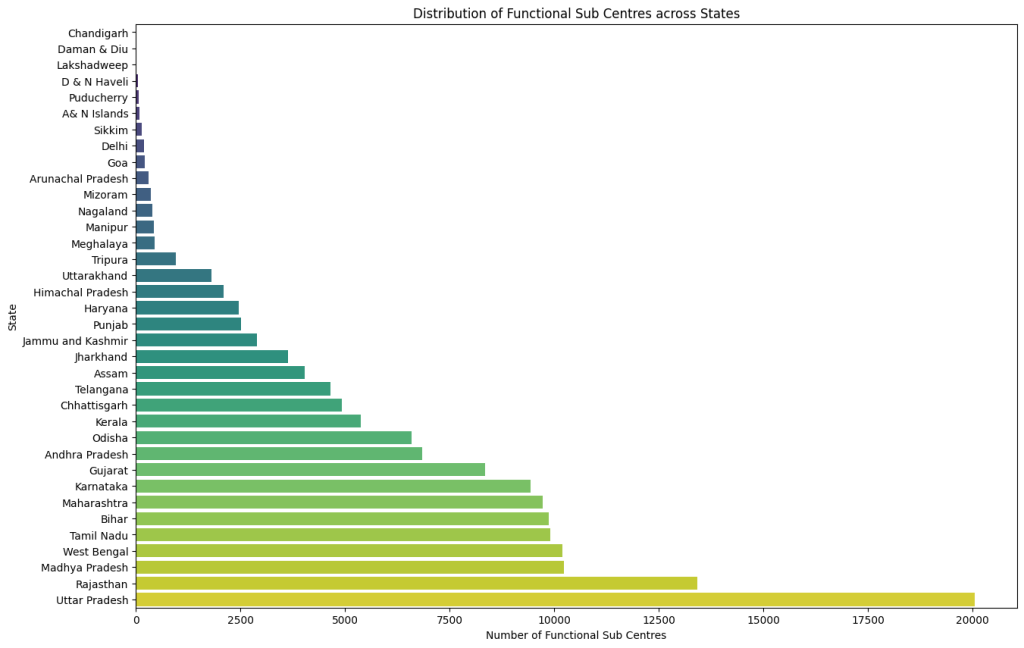
Comprehensive Data Analysis of Primary Health Centre Distribution in Indian States
Insights from this data analysis:
- Variability across states: There is significant variability in the number of functional primary health centers across different states. Some states have a considerably higher number of PHCs compared to others.
- Top States with high Primary Health Centers: States such as Andhra Pradesh, Uttar Pradesh, and Maharashtra appear to have a high number of functional primary health centers. This could be due to larger populations and greater demand for primary healthcare services in these states.
- States with low PHCs: On the other hand, states like Arunachal Pradesh, Nagaland, and Sikkim have relatively fewer functional primary health centers. This could be due to smaller populations, geographic challenges, or different healthcare infrastructure policies.
- Healthcare Infrastructure Disparity: The disparity in the number of PHCs across states indicates differences in healthcare infrastructure development and resource allocation. States with fewer PHCs might face challenges in providing accessible primary healthcare to their populations.
- Potential Areas for Improvement: States with a lower number of PHCs might need targeted interventions to improve their primary healthcare infrastructure. This could involve increasing the number of PHCs, improving existing facilities, and ensuring better resource distribution.
- Policy Implications: Policymakers can use this analysis to identify regions with inadequate primary healthcare facilities and prioritize them for healthcare infrastructure development. Ensuring equitable distribution of healthcare resources is essential for improving overall public health.
If you wish to learn data analysis and curve your career in the data science field feel free to join our free workshop on Masters in Data Science with PowerBI, where you will get to know how exactly the data science field works and why companies are ready to pay handsome salaries in this field.
In this workshop, you will get to know each tool and technology of data analysis from scratch that will make you skillfully eligible for any data science profile.
To join this workshop, register yourself on consoleflare and we will call you back.
Thinking, Why Console Flare?
- Recently, ConsoleFlare has been recognized as one of the Top 10 Most Promising Data Science Training Institutes of 2023.
- Console Flare offers the opportunity to learn Data Science in Hindi, just like how you speak daily.
- Console Flare believes in the idea of “What to learn and what not to learn” and this can be seen in their curriculum structure. They have designed their program based on what you need to learn for data science and nothing else.
- Want more reasons,


