Python, a popular programming language for data analysis and machine learning, offers a range of powerful data visualization tools & techniques.
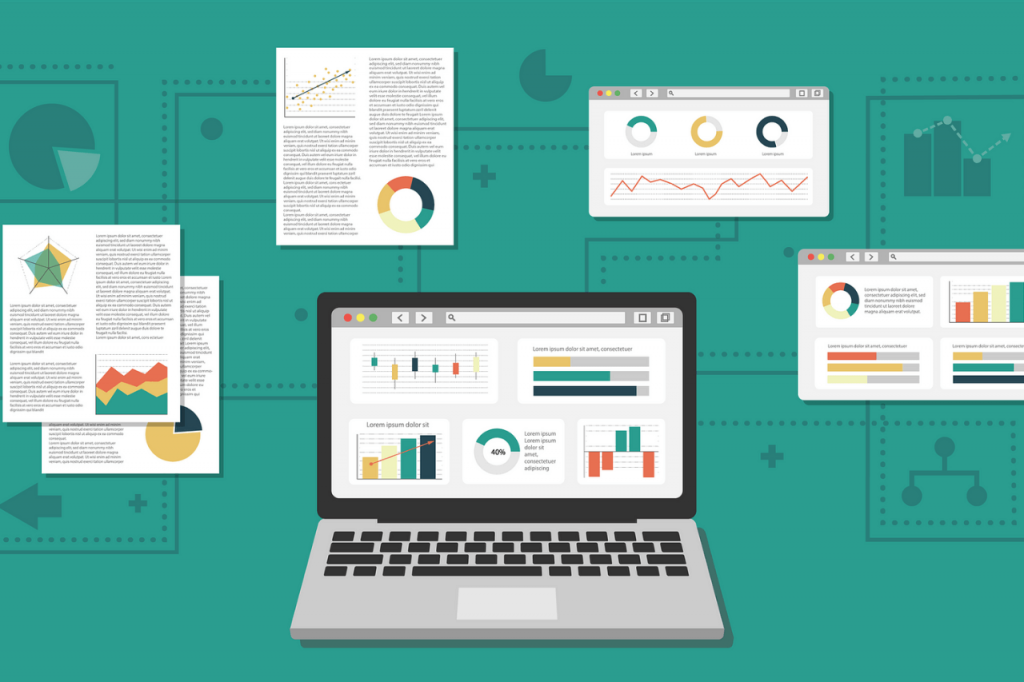
Data visualization is the process of representing data and information in a graphical or visual format. It involves creating visual representations of data to help people better understand and interpret information. The goal of data visualization is to make complex data easier to understand, analyze, and communicate. It allows individuals to quickly identify patterns, trends, and outliers in data, which can lead to better insights and decision-making.
Data visualization techniques can take many forms, including charts, graphs, maps, and diagrams. For example, line charts are often used to show trends over time, while bar charts are used to compare different values or categories. Maps can be used to represent geographical data, and diagrams can be used to show relationships or hierarchies between different data points.
You’re reading the article, Python Data Visualization Tools & Techniques.
Data visualization is an important tool in various fields, including business, finance, healthcare, and scientific research. It can help organizations and individuals understand complex data sets, identify patterns and trends, and communicate insights to stakeholders. In addition, with the increasing availability of data and the need to make data-driven decisions, data visualization has become an essential tool for data analysts, scientists, and decision-makers.
Data visualization is an essential aspect of data analysis. It allows us to explore and understand data, identify patterns, and communicate insights effectively. In this article, we will explore some of the popular data visualization techniques and tools in Python.
Popular Data Visualization Tools in Python
Matplotlib
Matplotlib is a widely used data visualization library in Python. It is a 2D plotting library that allows you to create various types of charts and graphs. With Matplotlib, you can create line charts, scatter plots, bar charts, histograms, and more. You can also customize your visualizations with labels, titles, legends, and colors. Matplotlib is highly customizable, making it a popular choice among data analysts and scientists.
You’re reading the article, Python Data Visualization Tools & Techniques.
Seaborn
Seaborn is a data visualization library that is built on top of Matplotlib. It offers a range of advanced visualizations, including heatmaps, violin plots, box plots, and more. Seaborn is known for its ability to create beautiful and informative visualizations with minimal code. It also offers built-in themes that allow you to customize the look and feel of your charts.
You’re reading the article, Python Data Visualization Tools & Techniques.
Plotly
Plotly is an interactive data visualization library in Python. It offers a range of interactive charts and graphs that allow users to explore and interact with data. With Plotly, you can create interactive scatter plots, line charts, area charts, heat maps, and more. You can also add interactivity to your visualizations, such as hover text, zoom, and pan. Plotly is a popular choice for creating interactive dashboards and reports.
You’re reading the article, Python Data Visualization Tools & Techniques.
Bokeh
Bokeh is another interactive data visualization library in Python. It allows you to create interactive visualizations with minimal coding. Bokeh supports a range of interactive features, including zoom, pan, and hover. It also offers a range of built-in tools, such as box select, lasso select, and more. Bokeh is a popular choice for creating interactive visualizations for web applications.
You’re reading the article, Python Data Visualization Tools & Techniques.
Altair
Altair is a declarative data visualization library in Python. It allows you to create visualizations with a simple and intuitive syntax. Altair is built on top of Vega-Lite, a visualization grammar for creating interactive web-based visualizations. With Altair, you can create interactive visualizations with minimal coding. It also offers a range of advanced features, including linked brushing, layered visualizations, and more.
You’re reading the article, Python Data Visualization Tools & Techniques.
Pandas Visualization
Pandas is a popular data analysis library in Python. It offers a range of data manipulation tools, including data cleaning, filtering, and aggregation. Pandas also offer a built-in data visualization library that allows you to create basic charts and graphs. With Pandas Visualization, you can create line charts, scatter plots, bar charts, and more. Pandas Visualization is a convenient option for creating quick and simple visualizations.
In conclusion, Python offers a range of powerful data visualization techniques and tools. From basic charts and graphs to advanced interactive visualizations, there is a Python library for every need. Whether you are a data analyst, scientist, or developer, Python data visualization libraries can help you explore and communicate insights effectively. So, explore these libraries and start creating beautiful and informative visualizations today.
Hope you liked reading the article, Python Data Visualization Tools & Techniques. Please share your thoughts in the comments section below.

