Best Data Analysis Tools in 2023
In today’s data-driven world, the importance of data analysis cannot be overstated. Data analysis helps organizations make informed decisions based on data-driven insights. However, for non-IT professionals, data analysis can be a daunting task. This is where tools like MS Excel come in handy. But, is MS Excel good for data analysis? Let’s find out.
You’re reading the article, Best Data Analysis Tools in 2023 For Non-IT Professionals.
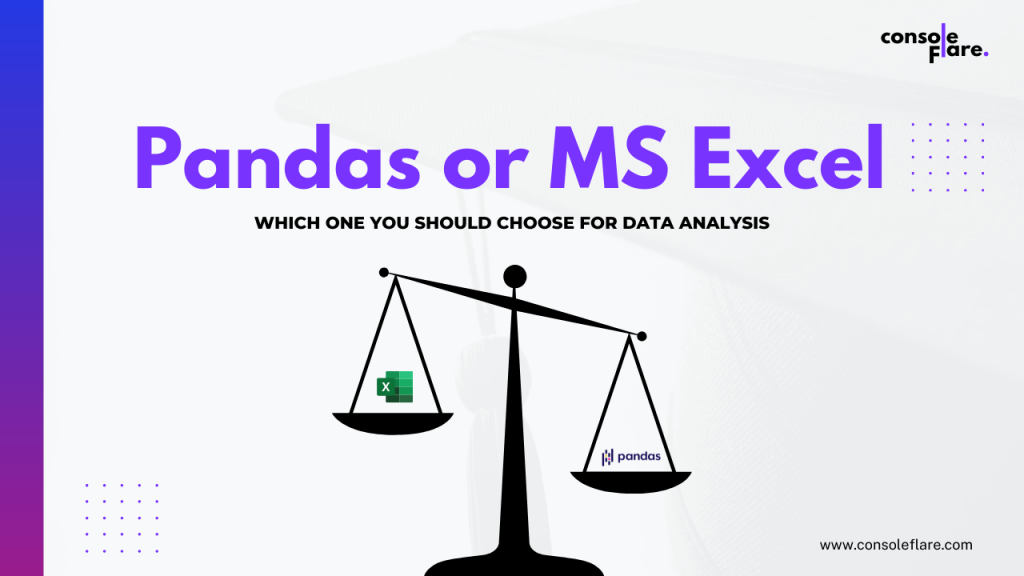
Is MS Excel Good for Data Analysis?
MS Excel is a widely used spreadsheet software that is often used for data analysis. It has many useful features that make it a good choice for basic data analysis tasks. However, as the complexity of data increases, the limitations of MS Excel become apparent.
For instance, Excel has a limit on the number of rows and columns it can handle, which makes it unsuitable for large datasets. Additionally, Excel is not designed for handling unstructured data like text and images, which limits its use in advanced data analysis.
You’re reading the article, Best Data Analysis Tools in 2023 For Non-IT Professionals.
Data Analytics Tools: Pandas, Matplotlib, Seaborn, and Power BI
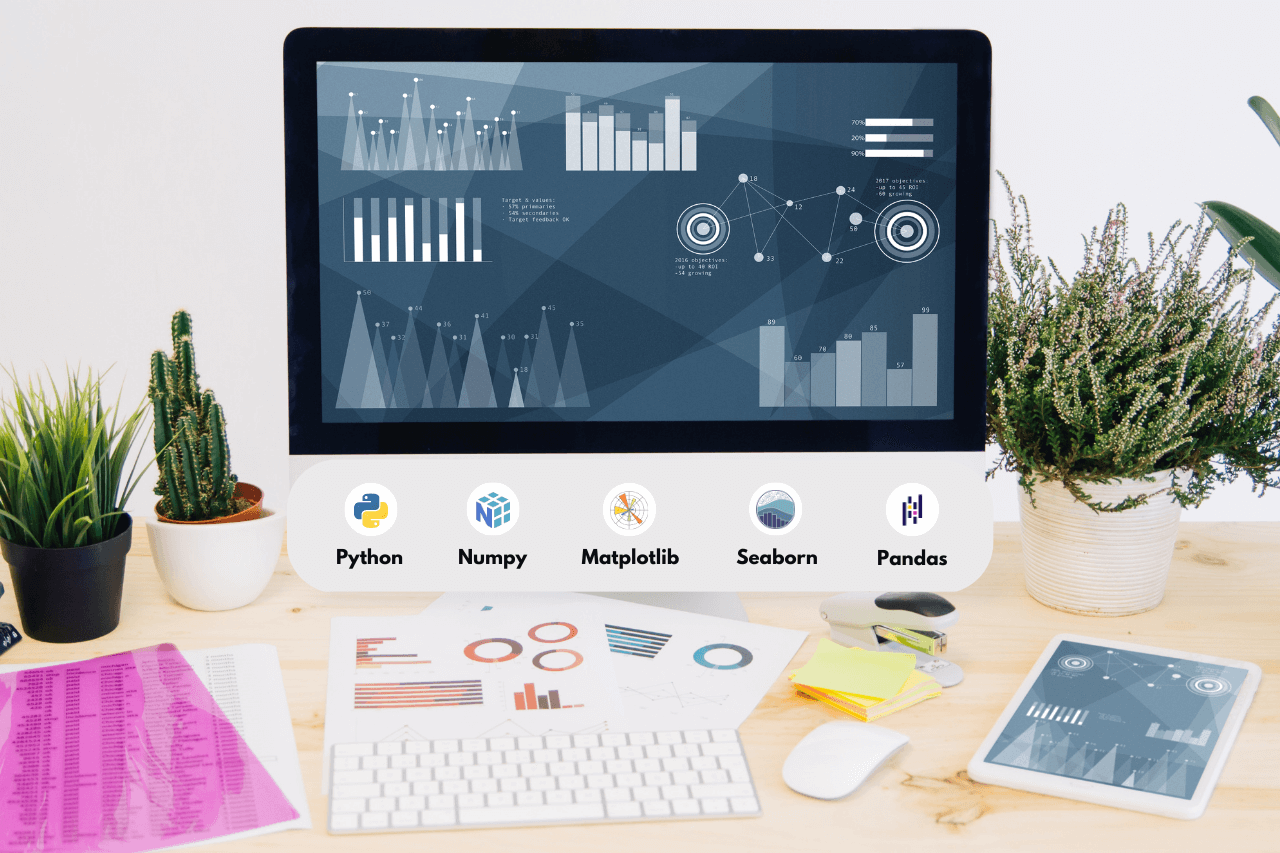
To overcome the limitations of MS Excel, data analysts use more advanced tools like Pandas, Matplotlib, Seaborn, and Power BI. These tools provide advanced data analysis & visualization capabilities and are better suited for handling large datasets and unstructured data.
Pandas is a Python library that provides data manipulation and analysis tools. It is designed to handle large datasets and can perform advanced data analysis tasks like data cleaning, transformation, and aggregation. Pandas is a Python-based library and is much faster than Excel and can handle millions of rows and columns with ease.
You’re reading the article, Best Data Analysis Tools in 2023 For Non-IT Professionals.
Matplotlib and Seaborn are data visualization libraries that provide advanced visualization capabilities. They allow analysts to create complex charts and graphs that are not possible with Excel. Matplotlib is the most popular data visualization library and provides a wide range of chart types. Seaborn, on the other hand, provides a higher-level interface for creating statistical graphics.
Power BI is a business analytics service that provides interactive visualizations and business intelligence capabilities. It allows analysts to connect to multiple data sources, transform data, and create interactive dashboards and reports. Power BI is a cloud-based service and is designed for collaboration and sharing.
Why Power BI is Better Than MS Excel?
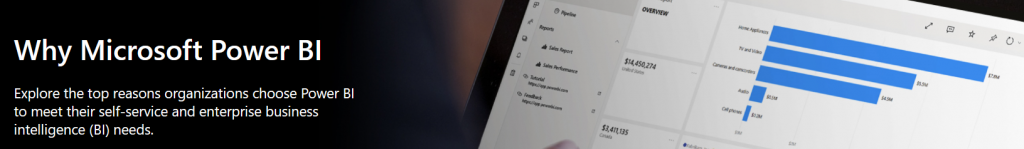
Power BI is a better choice than MS Excel for data analysis because it provides advanced data analysis capabilities, interactive visualizations, and collaboration features. It can handle large datasets and can connect to multiple data sources. Power BI also provides advanced security features that make it a better choice for organizations that deal with sensitive data.
You’re reading the article, Best Data Analysis Tools in 2023 For Non-IT Professionals.
Is MS Excel in Demand in Data Analysis Jobs?
While MS Excel is still widely used for basic data analysis tasks, data analysis jobs require advanced data analysis skills that go beyond Excel. To land a high-paying data analysis job in the 21st century, you need to have advanced data analysis skills and be proficient in tools like Pandas, Matplotlib, Seaborn, and Power BI.
You’re reading the article, Best Data Analysis Tools in 2023 For Non-IT Professionals.
Best Data Visualization Tools
Data visualization is an important aspect of data analysis, and there are many data visualization tools available that provide advanced visualization capabilities. In addition to Matplotlib and Seaborn, there are other popular data visualization tools like Tableau, QlikView, and D3.js.
These tools provide advanced visualization capabilities and are used by data analysts to create interactive dashboards and reports.
Learn Data Analysis Online
If you’re interested in learning data analysis, there are many online resources available that can help you get started. Online data science courses from ConsoleFlare can be the best option that covers topics like data manipulation, visualization, and machine learning. Additionally, there are many YouTube channels and blogs that provide tutorials and guides on data analysis.
Hope you liked reading the article, Best Data Analysis Tools in 2023 For Non-IT Professionals. Please share your thoughts in the comments section below.